

Data & Intelligence Maturity Model
Introduction
In this current decade, Data and AI have become significant elements in the enterprise world. Almost all companies acknowledge the need and usage of Data and AI: companies ranging from startups, through SMEs and large multinationals, and varying in sector from Retailing & eCommerce, Media & Entertainment, Industrial production, Energy & Power, AgriTech and several others.
The Data & Intelligence Maturity Model is a structured framework for enterprises, that associates directly their business performance to their usage of data and intelligence in their activities. It helps enterprises to:
- Assess their current maturity level by measuring the productivity and performance improvement as a result of Data and AI usage,
- self-Analyse the maturity level at different hierarchies of the organisation – per project, in an end-to-end value-chain, in a full business division or business unit, and globally as an enterprise,
- transform to a data-driven entity: by leveraging data and intelligence to improve performance in existing businesses or value-chains,
- Evolve to a data-driven entity: leveraging data and intelligence to create new value, towards becoming a « data-driven » organisation.
Key Elements of the Methodology
The Data & Intelligence Maturity Model consists of two frameworks, namely:
- The Strategy framework: The strategy framework helps the leaders of an organisation in designing a data-driven vision, that is realistic and achievable, and that can be precisely interpreted by managers and co-workers at different levels,
- The Operational framework: The operational framework assists in three ways: first, it helps in measuring the current maturity level of an organisation at any point in time. Second, it helps in charting the roadmap for implementing the vision in different time horizons – short-term, medium-term and long-term. Third, it measures regularly the success achieved in the transformation process.
The Strategy Framework
The strategy framework helps the leaders of an organisation in designing a data-driven vision, in two ways:
- by determining the current level of maturity of the organisation in terms of its usage of Data and AI in its business activities.
- by identifying the goal or destination maturity level where they want to lead the organisation within a stipulated time (for e.g. in the current decade, within a 5-year plan, or even within the current business year).
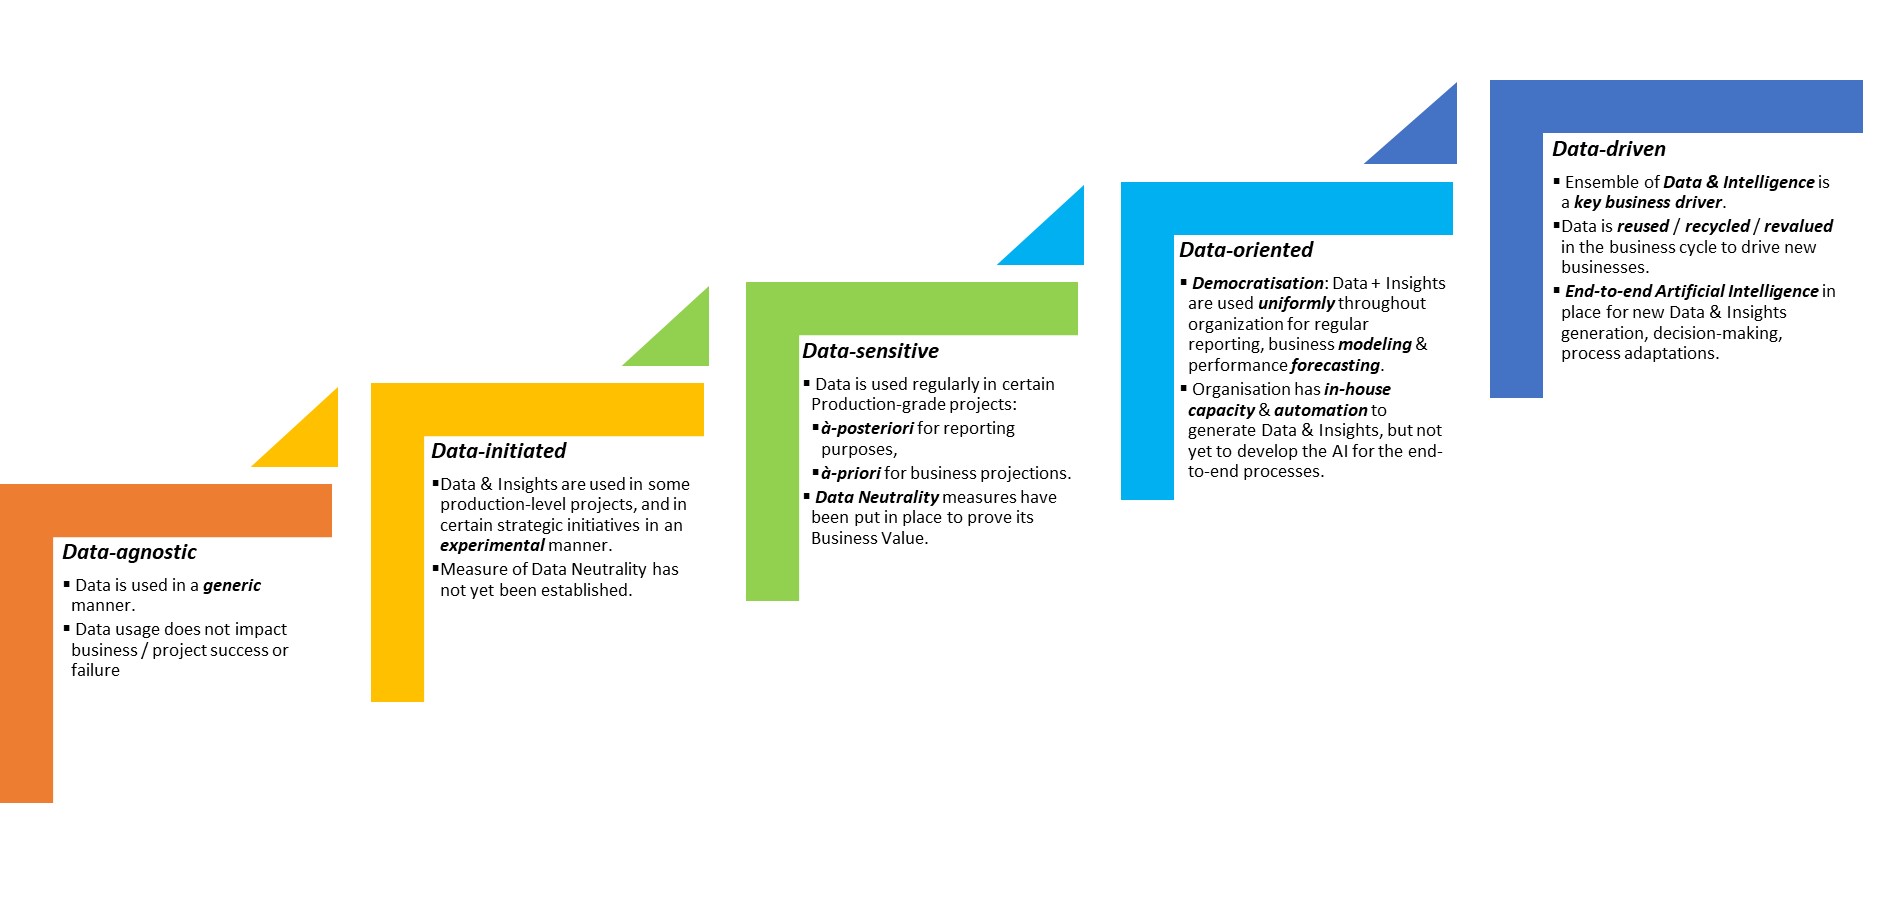
For this purpose, the strategy framework uses a 5-level maturity model with the following levels:
The detailed characteristics of the five maturity levels are explained in a later section.
The Operational Framework
Once the vision is defined by the strategy framework, the operational framework serves two main purposes, namely:
- create the Roadmap that the organisation has to follow to achieve its vision,
- measure the success of the transformation in the course of this Roadmap, and hence the maturity level achieved.
For this purpose, the operational framework draws heavily from data and intelligence to model and measure the following capacities:
- Generalist or Mandatory capacities: These are capacities that are common to organisations in all sectors and domains. Hence, these capacities need to be achieved and/or improved for all organisations to progress through the roadmap. They are as follows:
- Proof-of-Value
- Data Positivity / Data Neutrality
- PoC-to-Production Agility
- Data Democracy
- Legitimate Sharing & Protection
- User- or Customer-centric capacities: These capacities particularly important in sectors that involve end-users, end-customers or a human audience at the least. These capacities may be less relevant for domains such as industrial manufacture, food processing, etc. Nevertheless, these capacities are of utmost importance for user-facing or customer-facing businesses such as Retailing, Advertising, Services industries, etc. The capacities are as follows:
- Phygitality
- Personalisation @ Scale
- Rich Human eXperiences [RHX]
The detailed explanation of the above dimensions are explained in a subsequent section.
Connection between the Strategy Framework and the Operational Framework: The degree of evolution in the different capacities of the operational framework determines the overall maturity level of the organisation in the strategy framework.
Maturity Levels of the Strategy Framework
Data Agnostic
This is the initial level. At this stage, data is used in a generic manner, for elementary operations. E.g. for communications, accounting, etc. No key contribution from Data (e.g. Performance Measurement) is required.
Consequently, data usage does not directly impact the business or project success. There are no specific tools developed for the usage of data. Any off-the- shelf tools are used for this purpose.
Data Initiated
This is a critical Stepping Stone in the Data-driven journey. At this stage of maturity, an entity (an organisation, a project or a business division) acknowledges the relevance and utility of data for interpreting and explaining the current situation of the entity, primarily for reporting purposes. For e.g. explaining the business performance of an organisation or subsidiary, the degree of success of a project, the satisfaction of users / clients, etc.
Nevertheless, data is used to explain a business scenario « à posteriori ». It is not yet used to improve the performance, etc. We refer to this type of usage as read-only usage.
If an entity is at this level, it has the following characteristics:
- Data & Insights are used in some production-level projects, and in certain strategic initiatives in an experimental manner.
- Measure of Data Neutrality has not yet been established.
Data Sensitive
- Data is used regularly in certain Production-grade projects:
- à-posteriori for reporting purposes,
- à-priori for business projections.
- Data Neutrality measures have been put in place to prove its Business Value.
Data Oriented:
This is the stage where an entire organisation or country BU has reached the adequate level of rigour in using and applying Data and Intelligence in the majority of their business processes, and including the principal processes.
- Democratisation: Data + Insights are used uniformly throughout the organization for regular reporting, business modeling & performance forecasting.
- Organisation has in-house capacity & automation to generate Data & Insights, but not yet to develop the AI for the end-to-end processes.
Data Driven
This is the inversion point (also called Inflection point). When an entity enters this maturity level, data and intelligence evolve from key business-supporting elements to key business-drivers. In addition, Data and intelligence is used rigorously in strategic initiatives such as: omnichannel commerce, sustainability metrics, industry 4.0 / 4IR, personalised medicine, and the like.
- Ensemble of Data & Intelligence is a key business driver.
- Data is reused / recycled / revalued in global business processes to feed and drive new businesses.
- End-to-end Artificial Intelligence in place for new Data & Insights generation, decision-making, process adaptations.
Note: earlier the framework had only four levels, we have extended it to five levels in our new framework, to differenciate clearly the capacity of enterprises for usage and conversion between data and intelligence.
Capacities of the Operational Framework
Proof-of-Value
It is the net business value-add due to data and/or intelligence in any single activity within an organisation (enterprise or project). Proof-of-Value is a simple and pragmatic first step in quantifying the true value-add from Data and Intelligence.
From first principles, the Proof-of-Value by data and intelligence, in any business activity, is the net Business Value-add brought about with data and intelligence, normalised to the standard Business Value-add without the effort of data and intelligence. Hence,

Note: Proof-of-Value is expressed as a normalised pure ratio for different good reasons. In doing so,it can be used:
- independently, for analysing the performance of a single business activity,
- in comparison, to compare two business activities and their relative performance improvement due to usage of Data & AI.
- in a sum-over across a complete Value Chain. The respective Proof-of-Values from each business activity can be summed to yield an interesting global value. This is exactly what we are going to define in the next element.
Data Positivity / Data Neutrality
Once the Proof-of-Value is clearly defined for different business activities, the next step is to analyse and understand the end-to-end value-creation by Data and Intelligence, in the entire Value Chain. To this end, we define the Data Positivity of an entire Value Chain as :
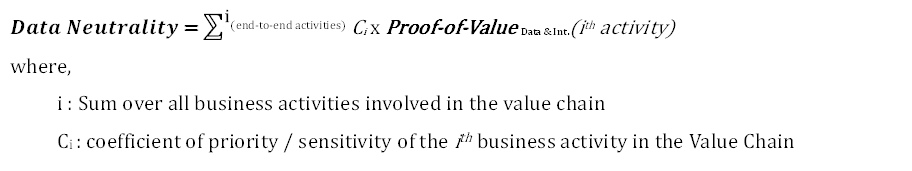
If the summation over the value chain is negative, then Data & Intelligence did not contribute positively to the overall business of that particular value-chain in the organisation. Naturally, the objective is to have a value chain that is Data Positive (rather than data neutral or data negative).
Note: With increasing level of maturity, the Data Positivity in an entire value-chain may exceed the simple sum of its parts, i.e. the sum of PoV of the business activities involved in a value-chain. This is the ideal scenario when the value-chain has been maximised for use of Data & Intelligence.
Poc-to-Production Agility
This is the capacity of an organisation:
- to spawn a wide and optimal variety of data-driven experiments that address specific business situations,
- and subsequently, to nurture and scale-up the most rewarding experiments into production grade solutions that are enmeshed into Business-As-Usual processes.
In other words, the capacity to engage in data-driven transformation and finally achieve it at scale.
At the heart of the data-driven culture is the intrinsic characteristic to experiment and validate business goals and objectives using data and intelligence. The data maturity level of an organisation thus depends strongly on its capacity to perform the widest variety of data-driven experiments, and from there, nurture and scale-up the most promising ones to production level in an Agile 4P process as follows:
Proof-of-Concept → Prototyping → Pilot → Production
PoC-to-Production Agility is a measure of this capacity. The following criteria contribute to this capacity:
Variety: The capacity to perform a rich variety of data-driven experiments that are intrinsically data-driven. A normalised quantifiable measure of this criterion is the ratio of the number of business activities where data-driven experiments are being performed (in a running Quarter), to the total number of business activities in the organisation.
Volume: The capacity to perform as many experiments as possible within the organisation that are intrinsically data-driven. A normalised measure of this criterion is the ratio of the number of data-driven experiments being performed (in a running Quarter), to the total number of experiments that are taking place in the organisation.
Scaleup: The capacity to identify and filter the most promising experiments and scale them up to production that is organisation-wide. A normalised measure of this criterion is the ratio of data-driven experiments that have moved to subsequent 4P phases (and finally to production), to the total number of experiments that were started in the organisation.
Agility: While experiments are being performed in the PoC-to-Production process, business goals and objectives may change. In this ever-changing landscape, it is the capacity to adapt and change course, without blocking current projects in production. This is a critical criterion in the current context of Covid.
Phygitality
This characteristic of an enterprise demonstrates its capacity for cross-attribution of business value arising from data and intelligence, between business activities in distinct value chains.
In an organisation, value-chains can involve multiple channels of activity, both Physical and Digital. Some example of channels are:
- Physical channels: Stores, home delivery services, warehouse-based activities, Distance-selling, Tele-services (Telephone-shopping, etc).
- Digital channels: web, mobile, social media channels, Youtube, Voice-AI assistants (e.g. Amazon Alexa, Google Meena, etc).
Mature or advanced businesses generally have a hybrid combination of Physical and Digital channels in their value-chains; hence the word, Phygital.
While operating any value-chain, data is generated and intelligence is derived in each channel, the quantity and quality depending on the maturity of the business. Consequently, Data & Intelligence can be shuffled around to feed activities happening in multiple channels as well as value-chains. For e.g. in a retailing enterprise that has both stores and websites, product views (data) and popularities (intelligence) on the web or mobile sites (Digital) can be used for improving in-store (Physical) merchandising. in-Store merchandising can even be refined or geographically localised based on geographically localised products views.
Phygitality is a cross-channel flow-based concept which involves the cross-attribution of business value from one business activity to another (in a separate value-chain). The degree of Phygitality is a measure of the cross-channel PoV attribution, and the details of calculating and measuring it will be derived in a future post. We address here three interesting classes of Phygitality. They are as follows:
Simple or unidirectional phygitality: If there is a significant cross-attribution of business value across two channels, flowing primarily in a single direction, i.e. from one business activity (in one channel) to another business activity (in another channel), then a simple phygitality is established. This is most often scenario of phygitality occurring in businesses with mature multiple channels.
Duplex & multiplex phygitality: In certain value chains, it s possible that there is a significant cross-attribution of business value in both directions, between a pair of activities in distinct channels. This means that in this pair, each business activity benefits significantly from data & intelligence arriving from the other. In this case, a duplex phygitality is established. If there are multiple instances of duplex cross-attribution across multiple business activities (in separate channels), we can generalise to multiplex phygitality.
Note: In both unidirectional and duplex phygitality, data pipelines or enterprise buses need to be built to facilitate the regular and automated exchange of data & intelligence between the participating business activities. As business activities evolve with time and get complex within their respective value-chains, so does the nature and quality of the data & intelligence exchanged. Hence, the relevant exchange pipelines need to be updated accordingly. Hence, such type of phygitality comes with a cost, referred to as the technical debt of the data pipeline solution.
Headless phygitality: In contrast to the above two classes of phygitality, this is a complete paradigm shift in the concept of phygitality. In this scenario, flow of Data & Intelligence is not through point-to-point exchanges. Rather the various data & intelligence generated from the different business activities are made available as single source of truth, to all business activities both current as well as future ones. Any business activity, existing or newly created fetches the data & intelligence from a single plane of access.
Headless phygitality is an ultimate level as it decouples the (conceptual) construction of new value-chains from the technical aspect building the data pipeline. It renders extreme agility during the process of designing and experimenting new value-chains, or trialing the transformation of existing value-chains (performance exercise in improving the end-to-end Data-Positivity of an existing value-chain). Hence, headless phygitality is associated with the highest levels of maturity in the DIMM strategy framework.
Personalisation @ Scale
Gone are the days of blind mass-mailing in letterboxes. As much as consumer/clients detest being bombarded with irrelevant advertisements, retailers wish to spend their advertising and marketing budgets judiciously towards targeted customers. Hence, personalisation is key. Nevertheless, scale is of importance to finally generate large volume of sales after personalisation. As a consequence, personalised recommendations and targetting@ Scale become the holy grail of client-centric businesses.
The usage of Data & Intelligence addresses this challenge to develop the necessary capacity across several classes or levels:
- Product-based personalisations: At this level, Data & Intelligence provides the necessary capacity to customise a baseline product or service based on different features/functionalities. This is often the case for product-oriented and service-oriented companies. By extracting intelligence generated from customer preferences and demographic data (collected at periodic intervals), a list of features are prioritised in the product or service, that may appear interesting to particular customer segments. The business then refines the baseline product (or service) into a series of personalised products to increase the attractivity towards the corresponding targeted customer segment. Cellphone manufacturers, travel & hospitality services and car manufacturers are examples of this class of personalisation.
- Profile-based personalisations: based on different demographic characteristics, nevertheless aggregated as a class or segment.
- 1-to-1 Matching: This is the ultimate level, where a specific product or offer can be recommended to a specific customer based on her/his personal preferences, attributes and history.
Rich Human eXperiences [RHX]
This is the capacity of a business to intercept precisely the abstract appeal and satisfaction of its customer (CX) or user (UX) towards its offering (e.g. products, services, solutions, etc). Consequently, the capacity of a business to bank on this abstract experience towards its customers/users to refine its offering, the ultimate objective being monetisation – directly or indirectly.
Hence, the RHX capacity of a business draws from two aspects:
- First in its capacity to intercept and analyse precisely the different dimensions of appeal and satisfaction of its product or service as perceived by the user/customer,
- Second, given the perception of experience by the customer/user, the capacity of the business to monetise optimally the experience.
Be it for analysing the RHX perception of its products, or for monetising the RHX perception, the business needs to refine its capacity along 3 dimensions of CX/UX in a differenciable manner:
- Learning eXperience (LX): appeal or experience with an informative or learning factor towards users/customers,
- Deductive eXperience (DX): appeal or experience inducing after-thoughts and deductive reasoning in the minds of its customers/users,
- Emotional eXperience (LX): interactions or experiences that can influence the emotions and sentiments.
The overall UX or CX is a vector composition of the above three components. Following is a schematic diagram with examples to demonstrate.

Analysing and Monetising Rich Human eXperiences is a dedicated branch of behavioural analytics in itself. The reader interested in this subject can explore in further details in this independent post.
| Charact-eristics | Level-1 Data-Agnostic | Level-2 Data-Initiated | Level-3 Data-Sensitive | Level-4 Data-Oriented | Level-5 Data-Driven |
|---|---|---|---|---|---|
| Key attributes | Business success can be achieved without need of Data & Insights. | Applicability of Data to analyse business correctly has been shown | Data & some Insights are being used in certain projects & processes. The Digital organisation has invested in Data & Analytics, both à posteriori (reporting) and à priori (predictive, projections) | Data & Intelligence are used in principal activities. Both à posteriori usage and à priori usage is practised. Data & Intelligence are used in different value chains: Digital and Physical. | Data & Intelligence create new Business Value. Data & Intelligence from multiple value chains can be inter-meshed to create truly Phygital businesses. |
| Extent / Granularity-level | Project, Value-chain, BU / Division, Enterprise | Project, Value-chain, BU / Division, Enterprise | Project, Value-chain, BU / Division, Enterprise | BU / Division, Enterprise | BU / Division, Enterprise |
| Proof-of-Value | Concept undefined using Data | Global PoV for a complete value-chain or business as a black-box. PoV cannot be fine-grained into individual activities | For certain business value-chains: Data & Insights can be used to drill-down global PoV into finer contributing activities | Digital & Physical value-chains are clearly parametris-ed and distinguish-able. Hence, PoV can be reasonably calculated | Data & Intelligence helps to create new PoV by inter-mingling value-add between Digital & Physical value-chains |
| Data Positivity | N/A | Notions of Data Positivity may exist but do not influence business decisions. | Data Positivity in experimental mode for specific initiatives or new value-chains. | Data Positivity measured uniformly, and for all projects and value-chains. DP used as a measure for projecting future businesses | Highly Data Positive value -chains. New businesses and value-chains are created using Data Positivity. |
| Phygitality [Physical + Digital channels] | Phygitality concept is not pertinent to the business | Cross-attribution of PoV between different value-chains cannot be calculated or does not exist altogether. | Core business value is focussed on only 1-2 primary channels. Hence, effect of Phygitality is not very relevant. | Low Phygitality: Channels are separated in distinct value-chains. Cross-attribution of Data & Intelligence from different channels, can be extrapolated, but not utilised. | High Phygitality: Cross-attribution of Data & Intelligence from multiple channels can be analysed for each value-chain. X-Attribution is used to optimise existing value-chains, and also to create new value-chains. |
Uniqueness of the approach
Though there have been several attempts to draw correlations between data usage and enterprise performance, there has not been any comprehensive and deductive framework to establish a strong causality between Data and company performance improvement – both in the historic context (a posteriori or reporting), as well as for the future (à priori or predictive). This article presents a comprehensive and structured framework for the above. In subsequent articles, the reader will be familiarised with the framework by applying it to enterprises in multiple sectors.
Recapitulative history
Back in 2015, we had introduced in a series of posts our initial « Data Maturity Model » and how it applies to an organisation. Over these five years, that model has evolved considerably. This has happened primarily due to the integration of applications and platforms that use Data and Artificial Intelligence (AI) in different forms. This integration into Data and Intelligence into mainstream activities has happened in different environments – enterprises, research labs and even households. Intelligence of different sorts are getting progressively assimilated into Business As Usual (BAU) and commercialised products.
Hence, it was time to overhaul our Data Maturity Model to incorporate the value-add of AI into the original framework. Together with Cambridge University Professor Kishore Sengupta, we enhanced the original model, to create this ultimate Data & Intelligence Maturity Model (DIMM).
Conclusion
In this post, we have explained the principal elements of the DIMM framework. In a subsequent post, we will delve into the fundamentals and technical details of the framework, and explain how to put it into practice in an organisation.
The above are the four principal elements that are required to applying the Data & Intelligence Maturity Model in any business. The framework can be applied either to a particular business line / value-chain, or a specific project, or an entire business unit, and even globally in an organisation.
Detailed examples can be provided from projects and consulting assignments that I have successfully accomplished applying this framework. For this purpose, please feel free to contact me by email.
Next page: The « Data & Intelligence Maturity Model » – Key Concepts
Go back: The Data Maturity Model (original)