
The Players: Who are Building the AI Infrastructure Empire?
Introduction: The Battle for AI Infrastructure Dominance
The AI infrastructure market has evolved from a hyperscaler triopoly into a complex, multi-layered ecosystem where specialized players are carving out significant niches. As we analyzed in the previous article, the unprecedented demand for GPU capacity—driven by a 28.3% CAGR through 2030 — has created opportunities for diverse business models to thrive.
Having evaluated principal Neoclouds/GPUaaS providers (CoreWeave, Lambda Labs, Scaleway, Nebius, Crusoe) and Colocation providers (Equinix, Digital Realty, NTT) across 15+ AI datacenter projects, I’ve witnessed first-hand how each player brings distinct advantages to different workload scenarios.
This second article in our three-part series examines the competitive dynamics shaping the AI infrastructure landscape. We’ll analyze market shares, strategic positioning, and provide detailed SWOT analyses for each player category. Article 3 will then dive into the technical architectures powering these facilities.
AI Practitioner’s View:
The market is not winner-take-all. By 2028, we’ll see a stratified ecosystem where hyperscalers dominate integrated enterprise workloads, neoclouds capture pure GPU training/inference at superior price-performance, and colocation providers serve as the critical “landlords” enabling rapid geographic expansion. The winners will be those who optimize for specific workload profiles rather than trying to be everything to everyone.
Part 1: The Incumbent Hyperscalers – Scale, Integration, and Ecosystem Lock-In
Market Position & Strategic Overview
The hyperscalers—AWS, Microsoft Azure, Google Cloud (GCP), and Oracle Cloud Infrastructure (OCI) — control approximately 65-70% of the global cloud infrastructure market and are leveraging their massive scale to dominate AI infrastructure deployment.
Market Share Breakdown (Q1 2024):
-
-
-
AWS: 31% market share, $25B quarterly revenue
-
Azure: 24% market share, $20B quarterly revenue
-
Google Cloud: 11% market share, $9.5B quarterly revenue
-
Oracle: 2-3% market share, but fastest growing at 55% YoY in cloud infrastructure
-
-
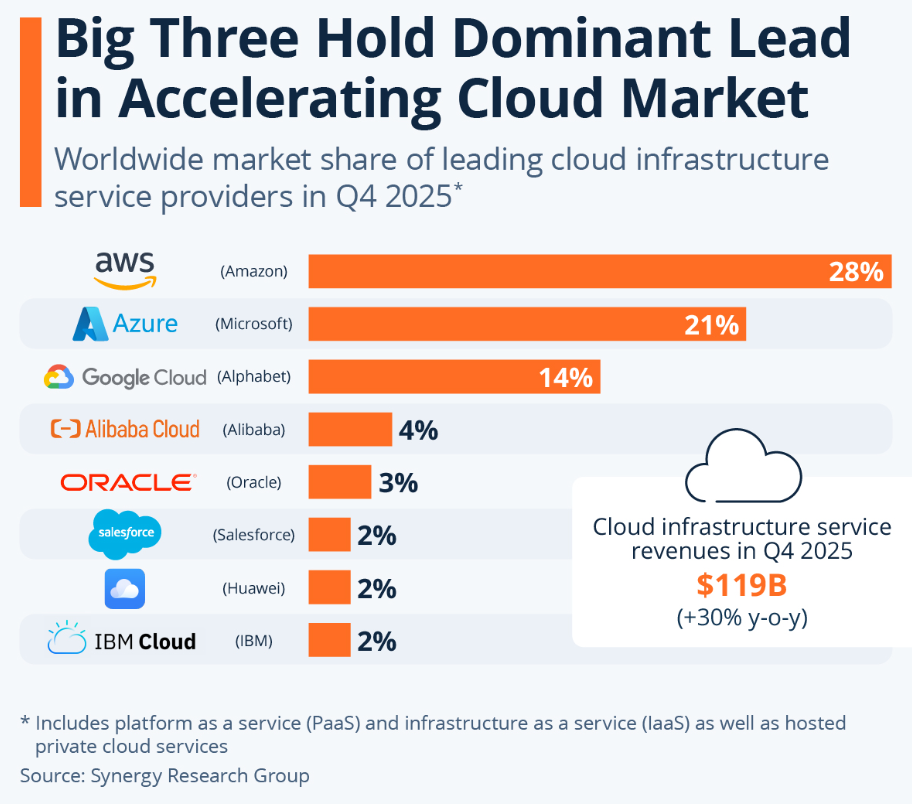
Global Cloud Infrastructure Market Share Q4 2025 (source: Synergy Research Group)
AWS (Amazon Web Services): The Volume Leader
Principal Offerings & Value Propositions:
-
-
AI/ML Services Portfolio:
-
SageMaker: End-to-end ML platform (training, tuning, deployment)
-
Bedrock: Managed foundation model access (Anthropic Claude, Meta Llama, AI21)
-
Trainium & Inferentia: Custom AI chips for cost-optimized workloads
-
EC2 P5/P4 Instances: NVIDIA H100/A100 GPU clusters
-
-
Infrastructure Scale:
-
33 geographic regions, 105+ availability zones
-
Estimated AI GPU capacity: 500,000+ GPUs (mix of NVIDIA and custom silicon)
-
Power capacity: 15+ GW globally, with 5 GW dedicated to AI workloads
-
-
Pricing Model:
-
On-demand: $32.77/hour for p5.48xlarge (8x H100 GPUs)
-
Reserved Instances: 30-60% discount for 1-3 year commitments
-
SageMaker: $1.50-$4.50/hour depending on instance type
-
-
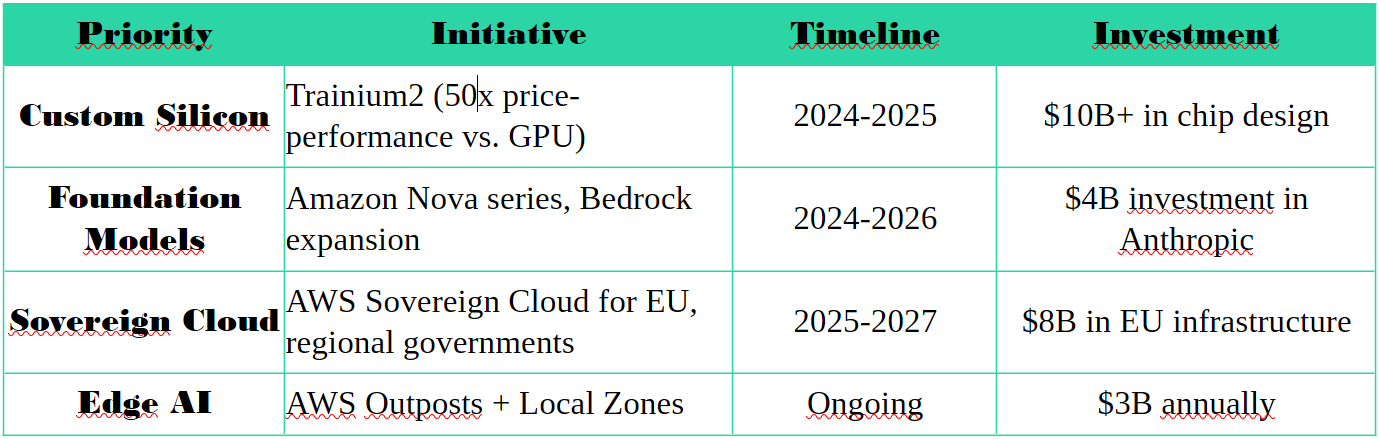
AWS Strategic Priorities:
AI Practitioner’s View:
AWS’s greatest strength is also its weakness — the sheer breadth of services creates complexity. For pure AI training workloads, neoclouds like CoreWeave often deliver 30-40% better price-performance. However, AWS wins on total cost of ownership when you factor in data egress, storage, and the ability to integrate AI with 200+ other AWS services. Enterprises running 80% of their IT on AWS will naturally choose SageMaker over specialized GPU clouds, even at a premium.
Microsoft Azure: The Enterprise Integration Champion
Principal Offerings & Value Propositions:
-
-
AI/ML Services Portfolio:
-
Azure OpenAI Service: Exclusive access to GPT-4, GPT-4o, DALL-E 3
-
Azure Machine Learning: MLOps platform with automated ML
-
Azure AI Studio: Foundation model development environment
-
NDv5/H100 Instances: NVIDIA GPU clusters with InfiniBand
-
-
Infrastructure Scale:
-
60+ regions globally (most of any hyperscaler)
-
Strategic partnership with OpenAI: Dedicated supercomputing infrastructure
-
Estimated AI GPU capacity: 400,000+ GPUs
-
Power capacity: 12+ GW, with aggressive expansion in secondary markets
-
-
Pricing Model:
-
NC A100 v4: $15.60/hour (8x A100 GPUs)
-
ND H100 v5: $35.00/hour (8x H100 GPUs)
-
Azure OpenAI: $0.03-$0.12 per 1K tokens (input/output)
-
-
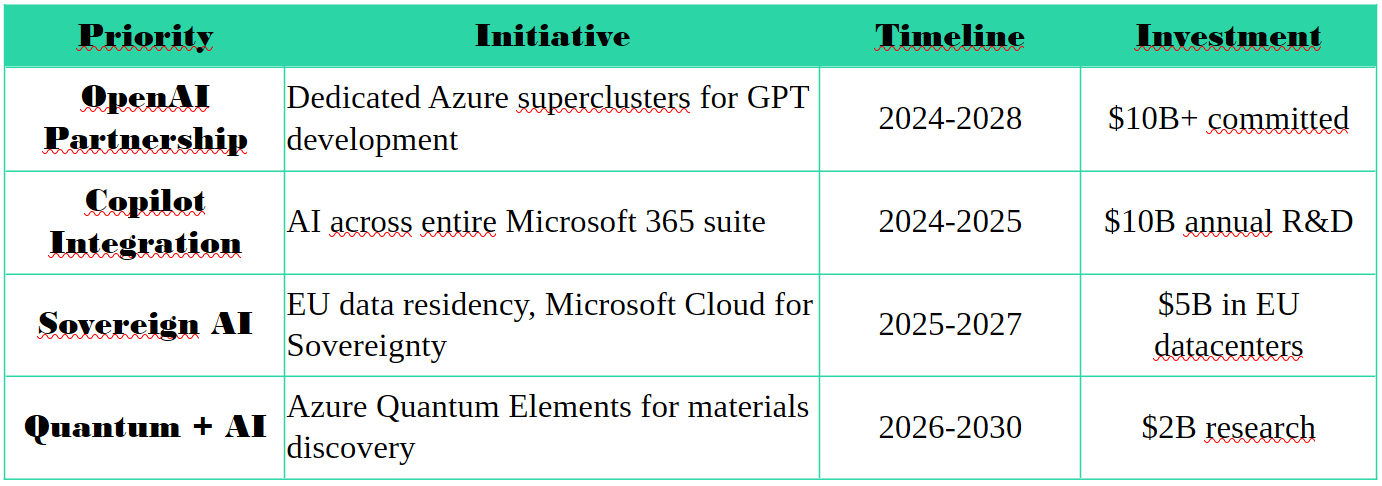
Azure Strategic Priorities:
AI Practitioner’s View:
Microsoft’s integration of AI into the Microsoft 365 ecosystem (Copilot in Word, Excel, Teams) is a masterstroke that locks in enterprise customers. While Azure’s raw GPU pricing is competitive with AWS, the real value is in seamless integration with Active Directory, SharePoint, and Dynamics 365. For enterprises already paying $30-50/user/month for M365, adding Copilot for $30/user/month is a no-brainer. This creates a moat that neoclouds cannot replicate.
Google Cloud Platform (GCP): The AI Research Leader
Principal Offerings & Value Propositions:
-
-
AI/ML Services Portfolio:
-
Vertex AI: Unified ML platform (training, deployment, MLOps)
-
Gemini API: Access to Gemini 1.5 Pro/Flash foundation models
-
TPU v5e/v5p: Custom Tensor Processing Units (up to 4,592 TFLOPS)
-
A3/A2 Instances: NVIDIA H100/A100 GPU VMs
-
-
Infrastructure Scale:
-
40+ regions, 120+ zones
-
TPU capacity: Largest deployment of custom AI accelerators globally
-
Estimated AI GPU capacity: 250,000+ GPUs + 100,000+ TPUs
-
Power capacity: 10+ GW, with strong renewable energy portfolio
-
-
Pricing Model:
-
A3 High-GPU (8x H100): $32.50/hour
-
TPU v5p: $4.50/chip/hour (significant cost advantage for TPU-optimized workloads)
-
Vertex AI: $0.0001-$0.0005 per prediction depending on model complexity
-
-
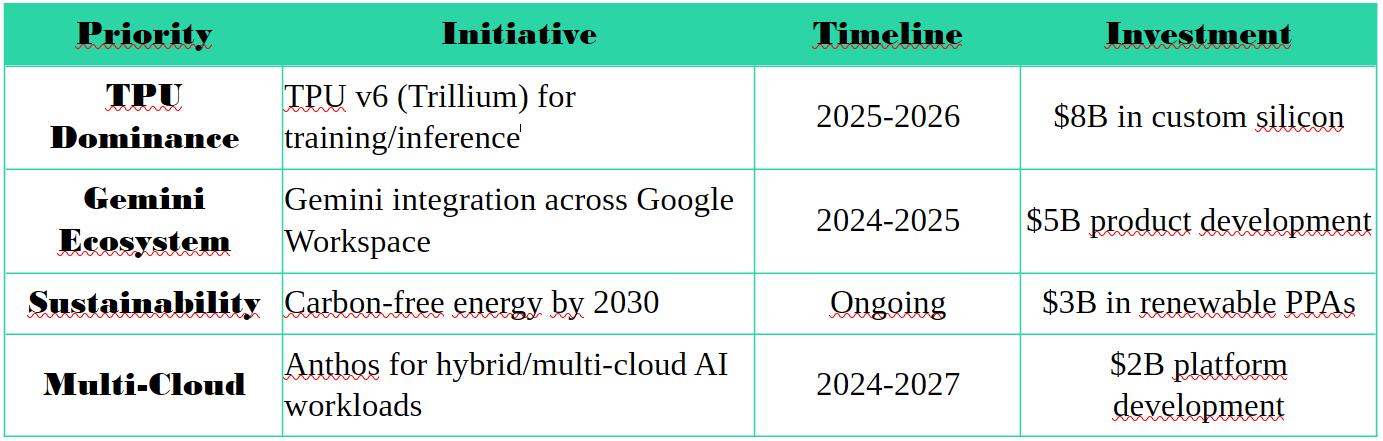
Google Cloud Strategic Priorities:
AI Practitioner’s View:
GCP’s TPU strategy is both its greatest strength and limitation. For workloads optimized for TPUs (TensorFlow, JAX), GCP delivers unmatched price-performance—often 40-50% cheaper than GPU equivalents. However, the CUDA ecosystem lock-in means most enterprises are reluctant to rewrite code for TPUs. GCP’s real opportunity is in AI-native startups building from scratch on JAX/TensorFlow, and in research institutions where TPU performance advantages are critical. For legacy enterprises, GCP remains a secondary cloud.
Oracle Cloud Infrastructure (OCI): The Aggressive Challenger
Principal Offerings & Value Propositions:
-
-
AI/ML Services Portfolio:
-
OCI Generative AI Service: Managed access to Llama 2, Cohere, custom models
-
AI Database: Autonomous Database with vector search, AI agents
-
OCI Data Science: MLOps platform for model development
-
BM.GPU.A3/A4 Instances: NVIDIA H100/H200 clusters with RDMA
-
-
Infrastructure Scale:
-
45+ regions, with aggressive expansion in secondary markets
-
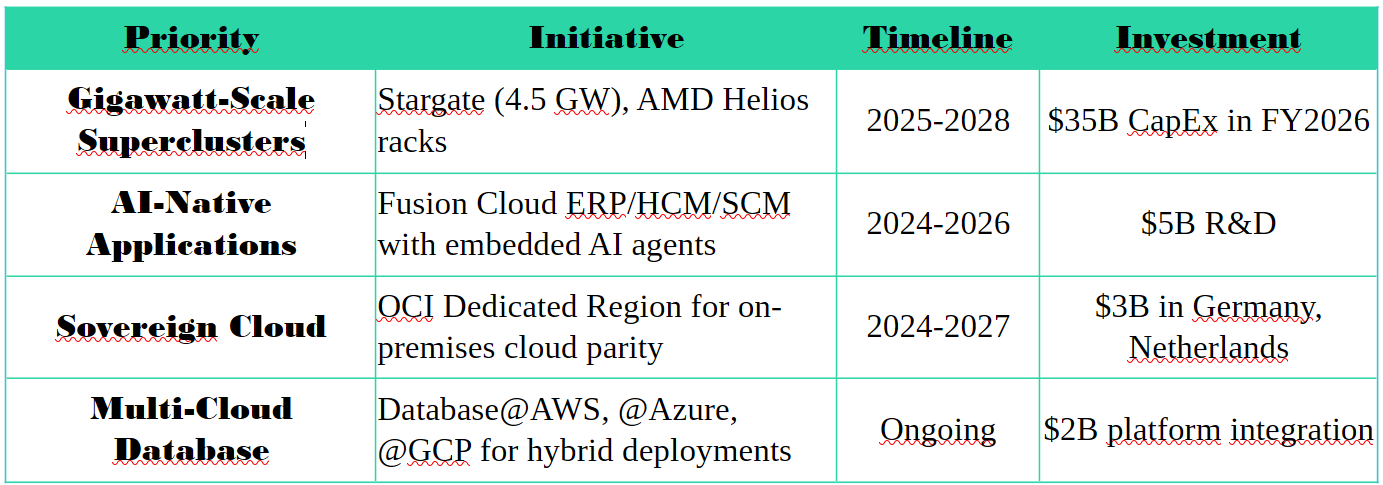
Stargate Partnership: 4.5 GW AI compute capacity with OpenAI/SoftBank
-
AMD Partnership: 50,000 MI450 GPUs deploying Q3 2026
-
Cloud Infrastructure Revenue: Projected $166B by FY2030 (from $8B in 2024)
-
-
Pricing Model:
-
BM.GPU.A3 (8x H100): $28.00/hour (12-15% cheaper than AWS/Azure)
-
OCI Generative AI: $0.0001-$0.001 per token (competitive with Azure OpenAI)
-
AI Database: Included in Autonomous Database pricing ($0.50-$3.00/OCPU/hour)
-
-
OCI Strategic Priorities:
Datacenter Practitioner’s View:
Oracle is executing a brilliant wedge strategy. Instead of competing head-to-head on general cloud services, OCI is dominating in three specific areas: (1) AI Database—vectorized data accessible by LLMs, (2) AI-Native Enterprise Applications—Fusion ERP/HCM with embedded AI agents, and (3) Gigawatt-scale AI training clusters for partners like OpenAI and xAI. The 30-40% gross margins on AI infrastructure contracts (vs. 20-25% for general cloud) validate this focus. Oracle won’t beat AWS on market share, but it can dominate high-margin AI workloads where database integration is critical.
Hyperscaler Comparative Analysis
Table 1: Hyperscaler AI Infrastructure Comparison
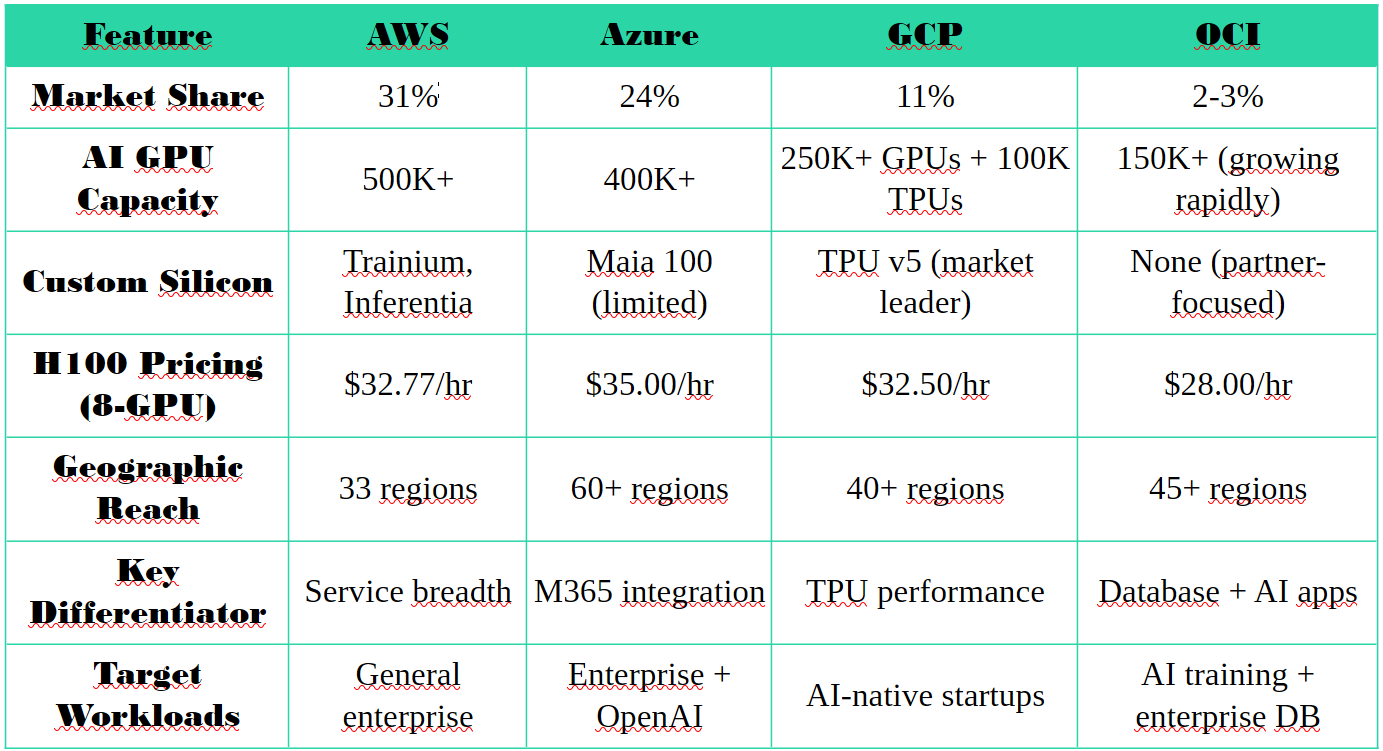
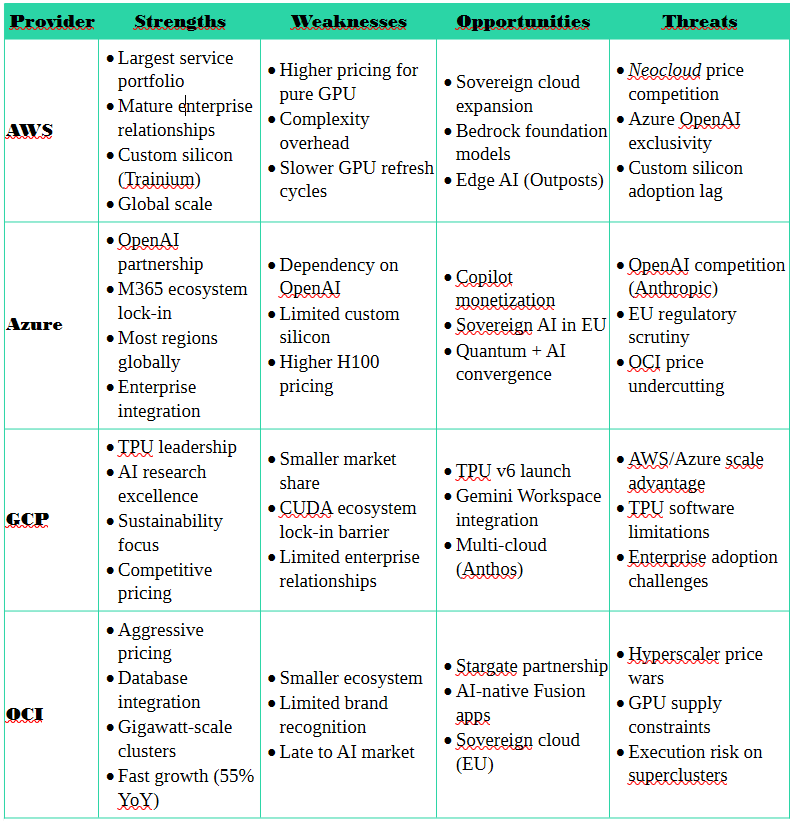
Table 2: Hyperscaler SWOT Analysis
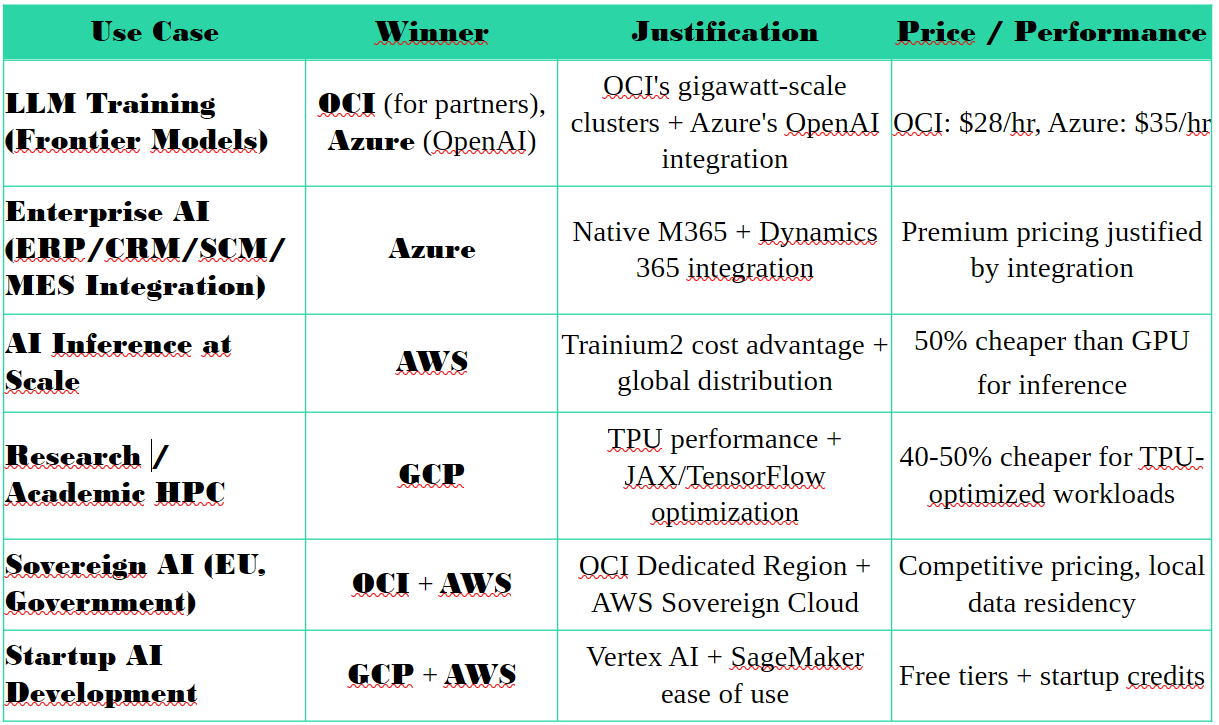
Hyperscaler “Who-Wins-Where” Scenarios
Table 3: Workload-Specific Hyperscaler Positioning
AI Practitioner’s View:
The hyperscaler battle is not about who has the most GPUs—it’s about workload fit and ecosystem lock-in. Azure wins when the customer is already paying for M365. AWS wins when the customer needs 200+ integrated services. GCP wins for AI-native workloads built on TensorFlow/JAX. OCI wins when the workload requires tight database integration or massive training scale. The key insight: enterprises will multi-cloud, using different providers for different AI workloads based on specific requirements.
Part 2: The Neoclouds & GPUaaS Providers – Agility, Specialization, and Price Disruption
Market Emergence & Value Proposition
The “neoclouds“—specialized GPU-as-a-Service (GPUaaS) providers like CoreWeave, Lambda Labs, Crusoe, Nebius, and Scaleway — have emerged as formidable competitors to hyperscalers by offering bare-metal GPU access at 30-50% lower prices with faster provisioning and deeper technical expertise.
Market Dynamics:
-
-
-
Total Addressable Market: $55B by 2030 (GPUaaS segment)
-
Growth Rate: 35-40% CAGR (faster than general cloud)
-
Primary Customers: AI startups, research institutions, enterprises with burst training needs
-
Key Advantage: Latest-generation GPUs (H100, B200) available 3-6 months before hyperscalers
-
-
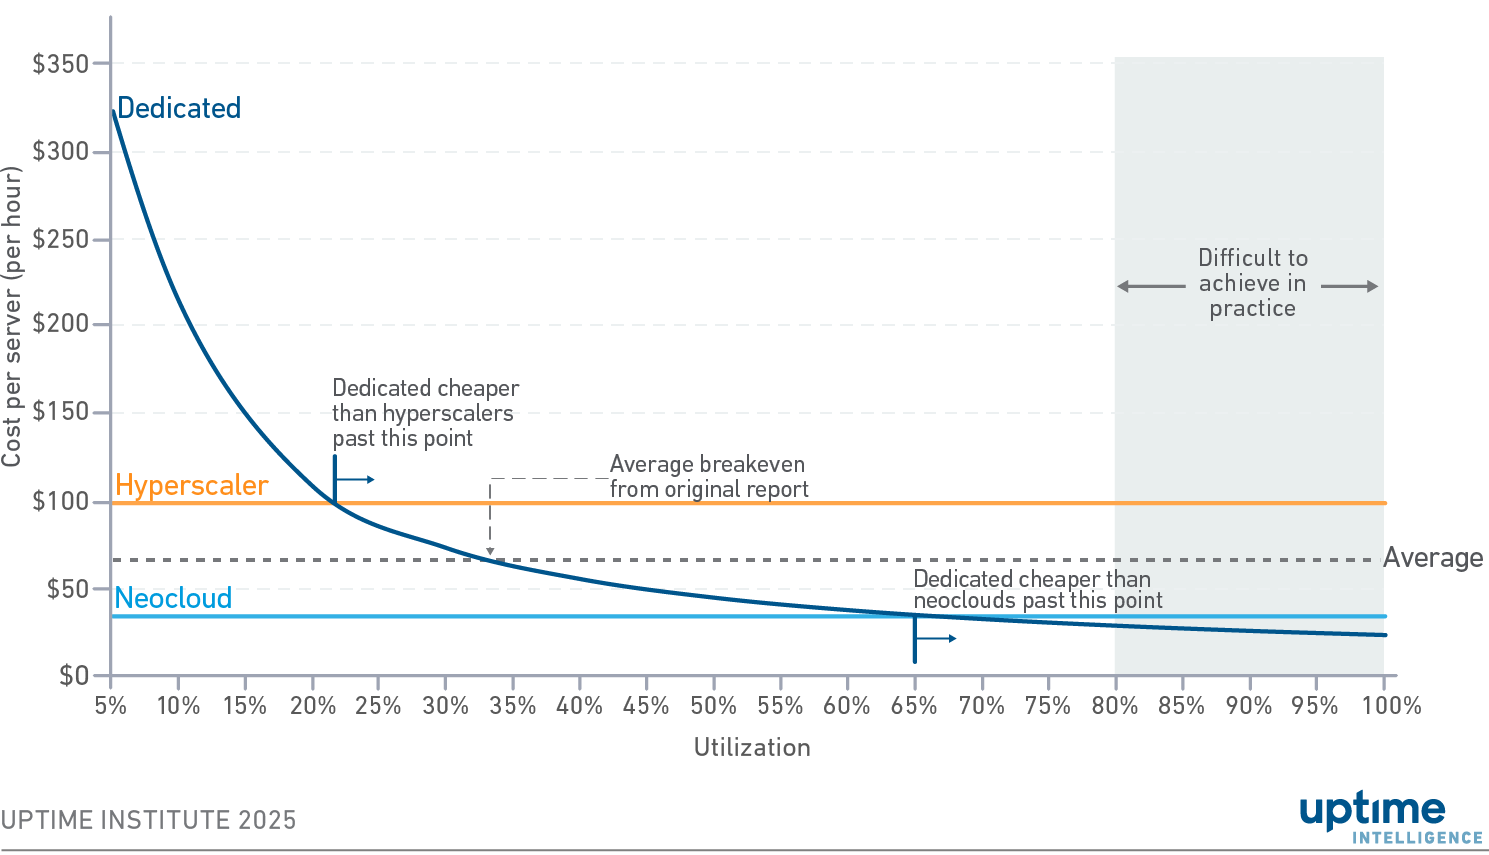 Neocloud vs. Hyperscaler GPU Pricing Comparison (source Uptime Institute)
CoreWeave: The GPU-First Disruptor
Principal Offerings & Value Propositions:
-
-
Infrastructure Specialization:
-
Bare-metal Kubernetes: Native K8s orchestration for GPU workloads
-
GPU Portfolio: 100,000+ NVIDIA H100/A100/L40S GPUs
-
Network: InfiniBand NDR (400 Gbps) for tightly-coupled training
-
Storage: High-performance NVMe (up to 100 GB/s per node)
-
-
Pricing Model:
-
H100 SXM5 (8-GPU): $18-22/hour (vs. AWS $32.77/hour = 33-45% cheaper)
-
A100 SXM4 (8-GPU): $12-15/hour (vs. AWS $24/hour = 37-50% cheaper)
-
Reserved Capacity: Additional 20-30% discount for 1-3 year commitments
-
Spot Instances: Up to 70% discount for interruptible workloads
-
-
Strategic Partnerships:
-
NVIDIA: Preferred partner status, early access to B200/GB200
-
Microsoft: $1.5B partnership for Azure overflow capacity
-
Inflection AI, Mistral AI: Anchor tenants for training clusters
-
-
Business Model & Financials:
-
-
Funding: $1.1B raised (valuation: $19B as of 2024)
-
Revenue: Estimated $500M-$750M annualized (2024)
-
Gross Margins: 35-40% (vs. hyperscaler 25-30% for GPU workloads)
-
Customer Concentration: Top 10 customers = 60% of revenue (typical for neoclouds)
-
AI Practitioner’s View:
CoreWeave’s Kubernetes-native architecture is a double-edged sword. For AI-native companies already using K8s, it’s a perfect fit—seamless integration, automated scaling, and superior price-performance. However, for traditional enterprises accustomed to AWS Management Console or Azure Portal, the learning curve is steep. CoreWeave wins on technical merit but loses on enterprise readiness. Their Microsoft partnership is brilliant—it lets Azure offload GPU overflow to CoreWeave while maintaining the customer relationship.
Lambda Labs: The Research-Focused Specialist
Principal Offerings & Value Propositions:
-
-
Infrastructure Specialization:
-
GPU Cloud: 50,000+ NVIDIA GPUs (H100, A100, A10, RTX 6000)
-
On-Premises Systems: DGX-style GPU servers for enterprise datacenters
-
Workstation GPUs: RTX 4090/6000 Ada for individual researchers
-
Software Stack: Pre-configured PyTorch, TensorFlow, JAX environments
-
-
Pricing Model:
-
H100 (8-GPU): $20-25/hour (competitive with CoreWeave)
-
A100 (8-GPU): $13-16/hour
-
RTX 6000 Ada: $2.50/hour (ideal for inference/development)
-
On-Prem: $200K-$500K per 8-GPU server (one-time CapEx)
-
-
Target Market:
-
Academic Research: 40% of customer base (universities, research labs)
-
AI Startups: 35% (seed to Series B stage)
-
Enterprise R&D: 25% (proof-of-concept, model development)
-
-
Strategic Positioning:
-
-
Differentiation: End-to-end GPU provider (cloud + on-prem + workstation)
-
Geographic Focus: Primarily US (Virginia, Texas, California), expanding to EU
-
Customer Support: Dedicated AI engineers (vs. ticket-based hyperscaler support)
-
AI Practitioner’s View:
Lambda’s hybrid model (cloud + on-prem) is strategically brilliant for research institutions. A university can buy on-prem DGX systems for sensitive data, use Lambda Cloud for burst capacity during grant-funded projects, and provision RTX workstations for individual researchers—all from one vendor. This creates stickiness that pure-play cloud providers can’t match. However, Lambda lacks the scale to compete for gigawatt-scale training workloads. Their sweet spot is mid-sized clusters (100-1,000 GPUs) for research and development.
Crusoe Energy: The Sustainability Pioneer
Principal Offerings & Value Propositions:
-
-
Unique Business Model:
-
Stranded Energy Capture: Deploy GPU clusters at oil/gas wellheads to utilize flared natural gas
-
Carbon-Negative AI: Convert wasted methane (25x more potent than CO₂) into compute
-
Renewable Integration: Co-locate with wind/solar farms for grid balancing
-
-
Infrastructure Specifications:
-
GPU Capacity: 20,000+ NVIDIA H100/A100 GPUs
-
Power Capacity: 300+ MW of stranded/renewable energy
-
Geographic Distribution: Texas, North Dakota, Wyoming (oil/gas regions)
-
PUE: 1.08 (vs. industry average 1.5) due to direct power capture
-
-
Pricing Model:
-
H100 Cloud: $22-26/hour (slightly premium vs. CoreWeave, justified by ESG benefits)
-
Carbon Credits: Customers receive verified carbon offsets (1 MWh = 0.5 tons CO₂e avoided)
-
Long-term PPAs: 5-10 year contracts for dedicated capacity
-
-
Target Customers:
-
-
ESG-Focused Enterprises: Microsoft, Salesforce (carbon-neutral AI commitments)
-
Energy Companies: Oil/gas firms offsetting flaring emissions
-
Government/Research: NSF, DOE (sustainability mandates)
-
AI Practitioner’s View:
Crusoe’s stranded energy model is either genius or niche, depending on your perspective. The economics are compelling: they pay $0.02-$0.03/kWh for stranded gas (vs. $0.07-$0.10/kWh grid power), enabling competitive pricing despite smaller scale. The ESG narrative resonates with enterprises facing investor pressure on carbon emissions. However, the model has limits: stranded energy is finite, geographic distribution is constrained to oil/gas regions, and scaling to gigawatt capacity requires massive land acquisition. Crusoe won’t replace hyperscalers, but it carves out a premium sustainability niche worth $2-5B annually.
European Neoclouds: Scaleway, Nebius, and Regional Players
Scaleway (France):
Principal Offerings:
-
-
-
GPU Instances: H100, A100, L40S (5,000+ GPUs)
-
Sovereign Cloud: GDPR-compliant, French data residency
-
Green Energy: 100% renewable (hydroelectric from French Alps)
-
Pricing: H100 (8-GPU) at €24/hour (~$26/hour)
-
-
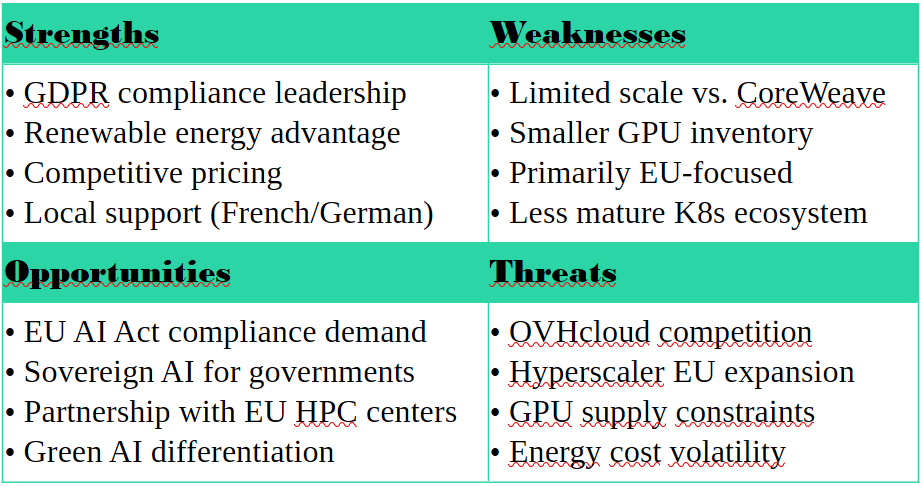
European Neoclouds SWOT Analysis:
Nebius (Netherlands):
Principal Offerings:
-
-
AI Cloud: NVIDIA H100/A100 clusters
-
Colocation Integration: Leverages parent company (Yandex) datacenter expertise
-
Amsterdam Hub: Low-latency connectivity to FLAP-D markets
-
Pricing: Competitive with Scaleway, focus on reserved capacity
-
Strategic Positioning:
-
-
Differentiation: Hybrid cloud + colocation model
-
Target Market: European enterprises requiring data sovereignty
-
Partnership Strategy: Collaborate with EU system integrators (Capgemini, Atos)
-
AI Practitioner’s View:
European neoclouds like Scaleway and Nebius have a regulatory moat that US-based CoreWeave cannot easily cross. The EU AI Act and GDPR create compliance requirements that favor local providers with established data residency frameworks. However, they face a scale dilemma: they need $500M-$1B in CapEx to compete with CoreWeave’s 100,000+ GPU deployments, but EU capital markets are more conservative than US VCs. My prediction: consolidation is inevitable, with Scaleway/Nebius either merging or being acquired by hyperscalers seeking EU sovereign cloud capabilities.
Neocloud Comparative Analysis
Table 4: Neocloud/GPUaaS Provider Comparison
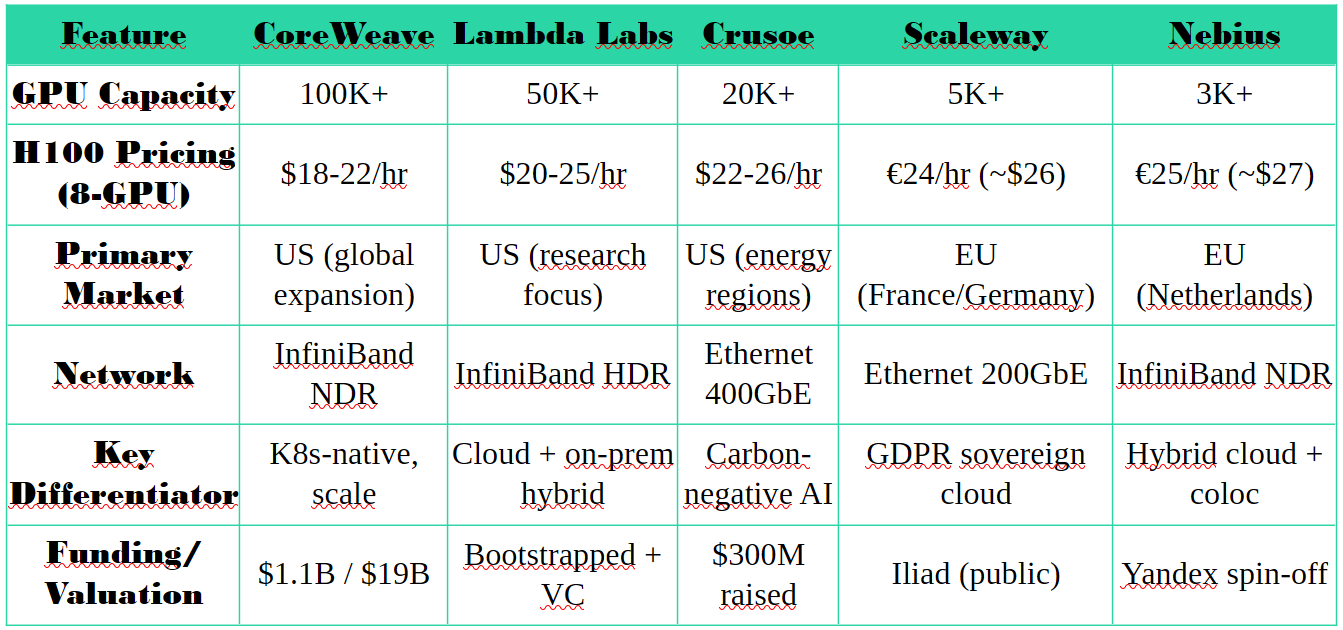
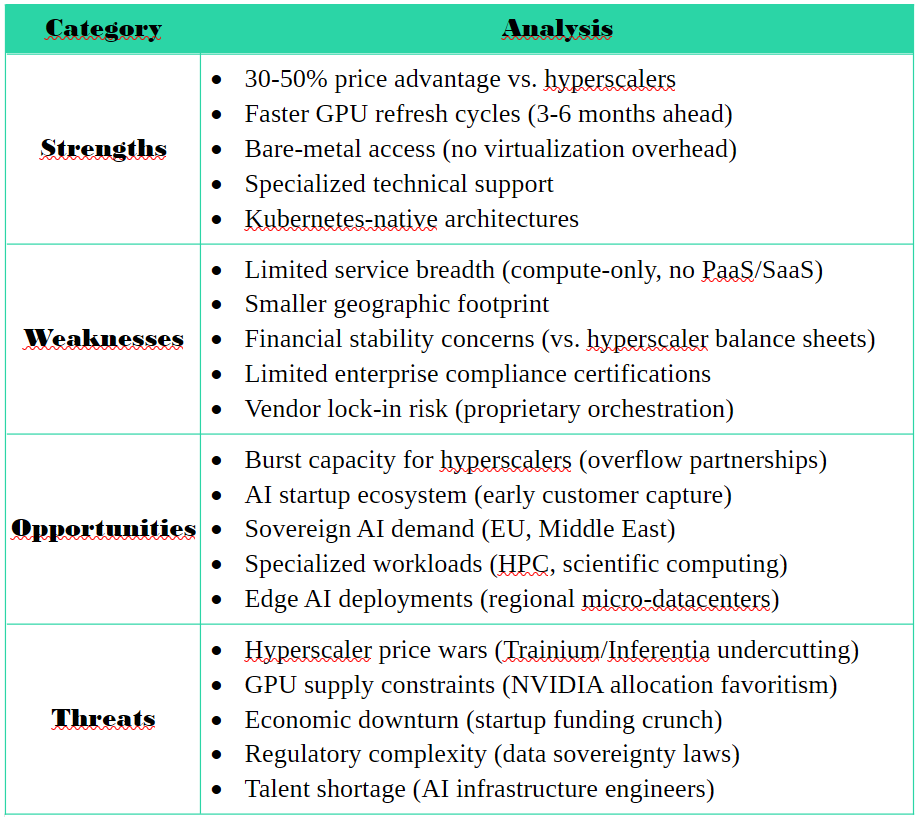
Table 5: Neocloud SWOT Analysis (Aggregated)
Neocloud “Who-Wins-Where” Scenarios
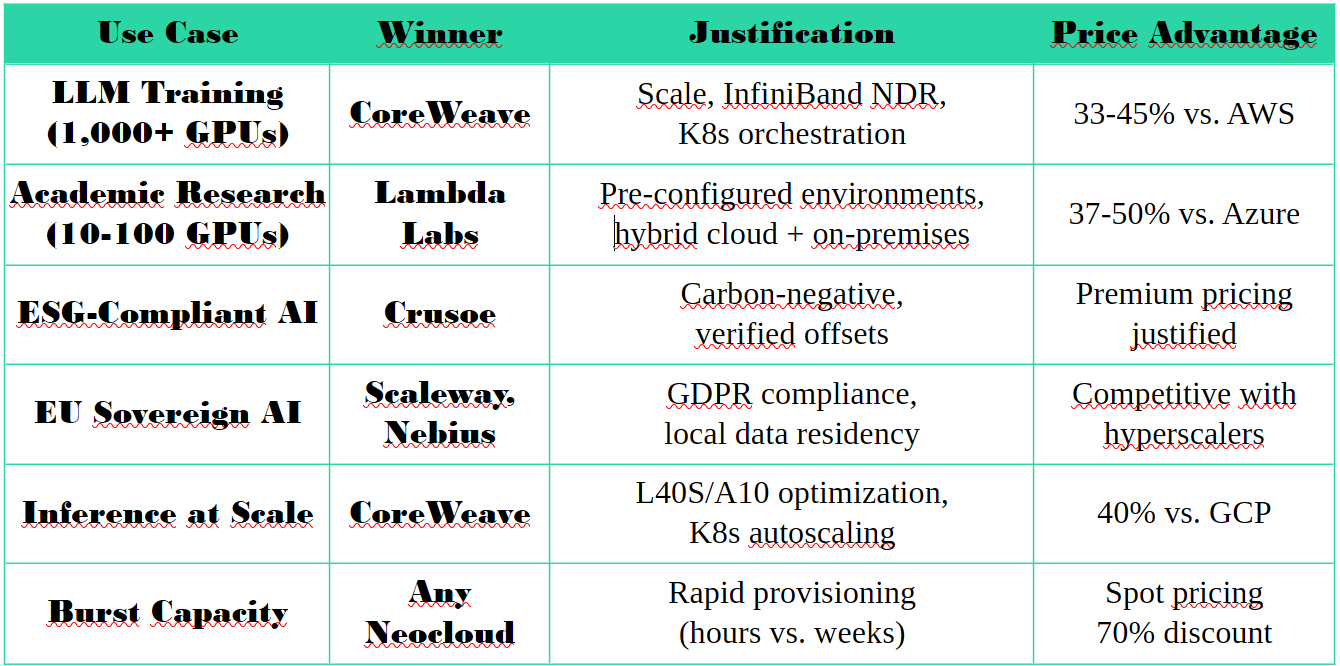
Table 6: Workload-Specific Neocloud Positioning
AI Practitioner’s View:
Neoclouds are not trying to be “everything clouds” — they are specialized weapons optimized for specific workloads. CoreWeave dominates large-scale training with superior networking and Kubernetes orchestration. Lambda owns the research segment with hybrid cloud + on-prem flexibility. Crusoe captures the ESG premium with carbon-negative AI. European players leverage regulatory moats for sovereign cloud workloads. The critical insight: neoclouds complement rather than replace hyperscalers. Enterprises will use neoclouds for burst training or cost-sensitive workloads while maintaining hyperscaler relationships for integrated services and global distribution.
Part 3: The Colocation Providers – The Landlords of the AI Race
Strategic Role & Market Evolution
Colocation providers—Equinix, Digital Realty, NTT Global Data Centers, and regional players — have evolved from offering basic “space and power” to becoming critical enablers of the AI infrastructure boom. They provide the physical foundation upon which hyperscalers, neoclouds, and enterprises build their AI capabilities.
Market Dynamics:
-
-
Total Addressable Market: $95B by 2030 (colocation + interconnection)
-
Growth Rate: 12-15% CAGR (steady, less volatile than GPUaaS)
-
Key Trend: Shift from 5-10 kW/rack to 40-100 kW/rack for AI workloads
-
Revenue Model: Recurring OpEx (rent + power + interconnection fees)
-
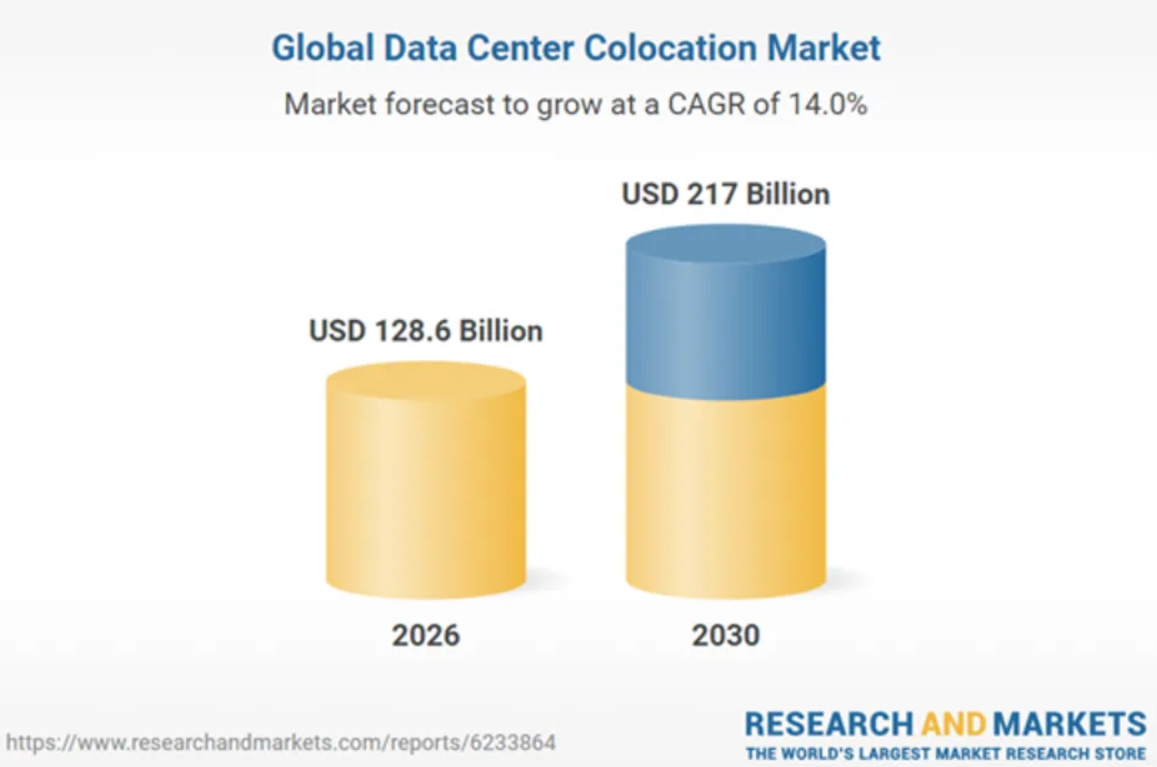
Global Colocation Provider Market Evolution 2026-2030 (source: Research & Markets)
Equinix: The Interconnection Leader
Principal Offerings & Value Propositions:
-
-
Global Infrastructure:
-
250+ datacenters across 70+ metros globally
-
Power Capacity: 2.5+ GW total, with 500 MW dedicated to AI/high-density
-
Network Density: 10,000+ network providers, 3,000+ cloud/on-ramp partners
-
AI-Ready Facilities: 40+ facilities with liquid cooling capability (2024), expanding to 100+ by 2026
-
-
AI-Specific Solutions:
-
Equinix AI Cloud: Partner ecosystem (CoreWeave, Lambda, hyperscalers)
-
High-Density Cabinets: 50-100 kW per rack (vs. industry standard 10-15 kW)
-
Liquid Cooling: Direct-to-chip and immersion cooling options
-
Fabric Interconnection: Sub-1ms latency between AI workloads and data sources
-
-
Pricing Model:
-
Standard Cabinet (5-10 kW): $2,000-$4,000/month
-
High-Density AI Cabinet (40-60 kW): $8,000-$15,000/month
-
Power: $0.12-$0.18/kWh (varies by market)
-
Cross-Connect: $100-$300/month per connection
-
Fabric Bandwidth: $0.02-$0.05/GB (volume discounts)
-
-
Strategic Partnerships:
-
-
NVIDIA: DGX Cloud deployment in Equinix facilities
-
CoreWeave: Primary colocation partner for US expansion
-
Hyperscalers: AWS Direct Connect, Azure ExpressRoute, Google Cloud Interconnect
-
AI Practitioner’s View:
Equinix’s interconnection density is an unassailable moat. When you can connect to 10,000+ networks and 3,000+ cloud providers from a single facility, the network effects create tremendous stickiness. For AI workloads requiring low-latency access to data sources (financial exchanges, healthcare systems, manufacturing IoT), Equinix is the logical choice. The challenge: retrofitting legacy facilities for 50-100 kW/rack densities requires $500M-$1B in CapEx per major market. Equinix is executing this transition, but it creates short-term margin pressure.
Digital Realty: The Hyperscaler’s Partner
Principal Offerings & Value Propositions:
-
-
Global Infrastructure:
-
300+ datacenters across 50+ countries
-
Power Capacity: 3.5+ GW total (largest of any colocation provider)
-
PlatformDIGITAL®: Software-defined interconnection platform
-
AI-Ready Facilities: 60+ facilities with high-density capability
-
-
Hyperscaler Strategy:
-
Build-to-Suit: Custom facilities for hyperscaler expansion (e.g., 100 MW+ campuses)
-
Powered Shell: Deliver land, power, cooling; hyperscaler installs IT equipment
-
Joint Ventures: Partnerships with hyperscalers for dedicated AI regions
-
-
Pricing Model:
-
Wholesale (MW-scale): $1.5M-$3M/month per MW (10-year contracts)
-
Retail Cabinets: $1,500-$3,500/month (5-10 kW)
-
High-Density AI: $7,000-$12,000/month (40-60 kW)
-
Power: $0.10-$0.16/kWh (competitive with Equinix)
-
-
Strategic Differentiation:
-
-
Scale Advantage: Largest power capacity enables gigawatt-scale AI campuses
-
Hyperscaler Relationships: Preferred partner for AWS, Azure, GCP expansion
-
Land Bank: 1,000+ acres of developable land in key markets
-
AI Practitioner’s View:
Digital Realty’s build-to-suit strategy is brilliant for the AI era. Instead of competing with hyperscalers, they enable hyperscaler expansion by handling the complex real estate, permitting, and power procurement. This creates long-term (10-15 year) contracts with credit-worthy tenants. The risk: customer concentration—top 10 customers represent 40% of revenue. If a major hyperscaler shifts strategy, Digital Realty faces significant exposure. However, the 4+ year lead time for power procurement creates a moat — hyperscalers can’t easily switch providers once they’ve committed.
NTT Global Data Centers: The Enterprise-Focused Player
Principal Offerings & Value Propositions:
-
-
Global Infrastructure:
-
150+ datacenters across 20+ countries
-
Power Capacity: 1.2+ GW total
-
Enterprise Focus: Strong presence in Asia-Pacific (Japan, Singapore, Australia)
-
Managed Services: Beyond colocation—managed IT, security, cloud migration
-
-
AI Capabilities:
-
High-Density Zones: 30-50 kW/rack in select facilities
-
Edge AI: Micro-datacenters for industrial IoT, smart manufacturing
-
Sovereign Cloud: Partnerships with local cloud providers for data residency
-
-
Pricing Model:
-
Colocation: $1,800-$3,200/month (5-10 kW cabinet)
-
High-Density: $6,000-$10,000/month (30-50 kW)
-
Managed Services: 20-40% premium over pure colocation
-
Power: $0.11-$0.15/kWh
-
-
Strategic Positioning:
-
-
Differentiation: Managed services + colocation (one-stop shop)
-
Geographic Strength: Asia-Pacific leadership (Japan #1 market share)
-
Target Market: Enterprise IT (vs. hyperscalers/neoclouds)
-
AI Practitioner’s View:
NTT’s managed services strategy appeals to enterprises that want colocation but lack in-house expertise to manage high-density AI infrastructure. They’re not competing for hyperscaler contracts; they’re serving traditional enterprises transitioning to AI workloads. The challenge: margin compression—managed services require 3-5x more staff per MW than pure colocation, reducing EBITDA margins to 25-30% (vs. Equinix/Digital Realty 40-45%). However, the stickiness is higher—enterprises rarely switch managed service providers.
Colocation Comparative Analysis
Table 7: Colocation Provider Comparison
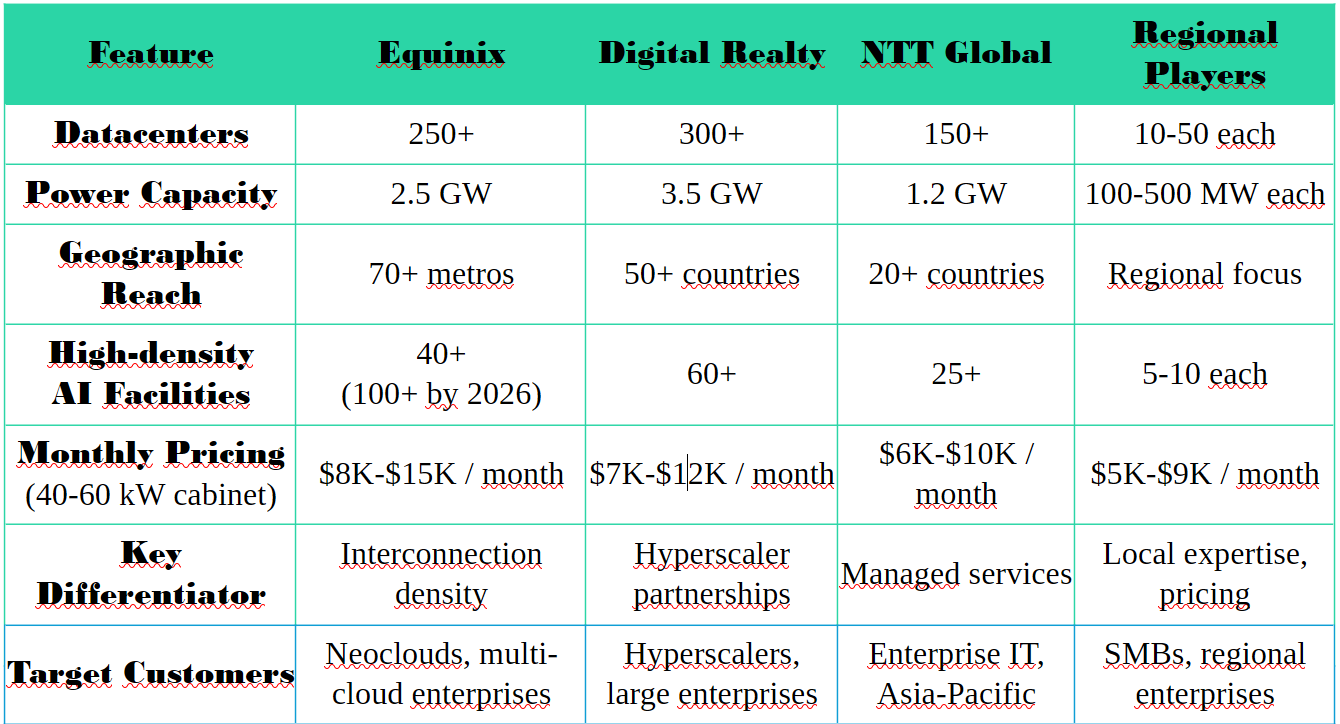
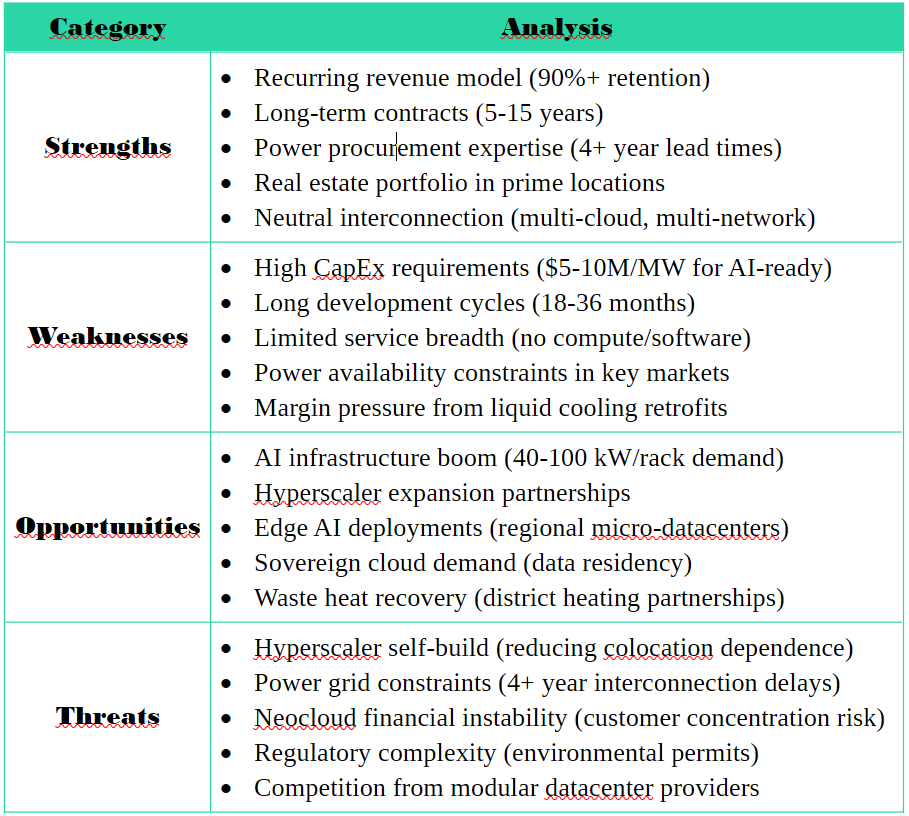
Table 8: Colocation SWOT Analysis (Aggregated)
Colocation “Who-Wins-Where” Scenarios
Table 9: Workload-Specific Colocation Positioning
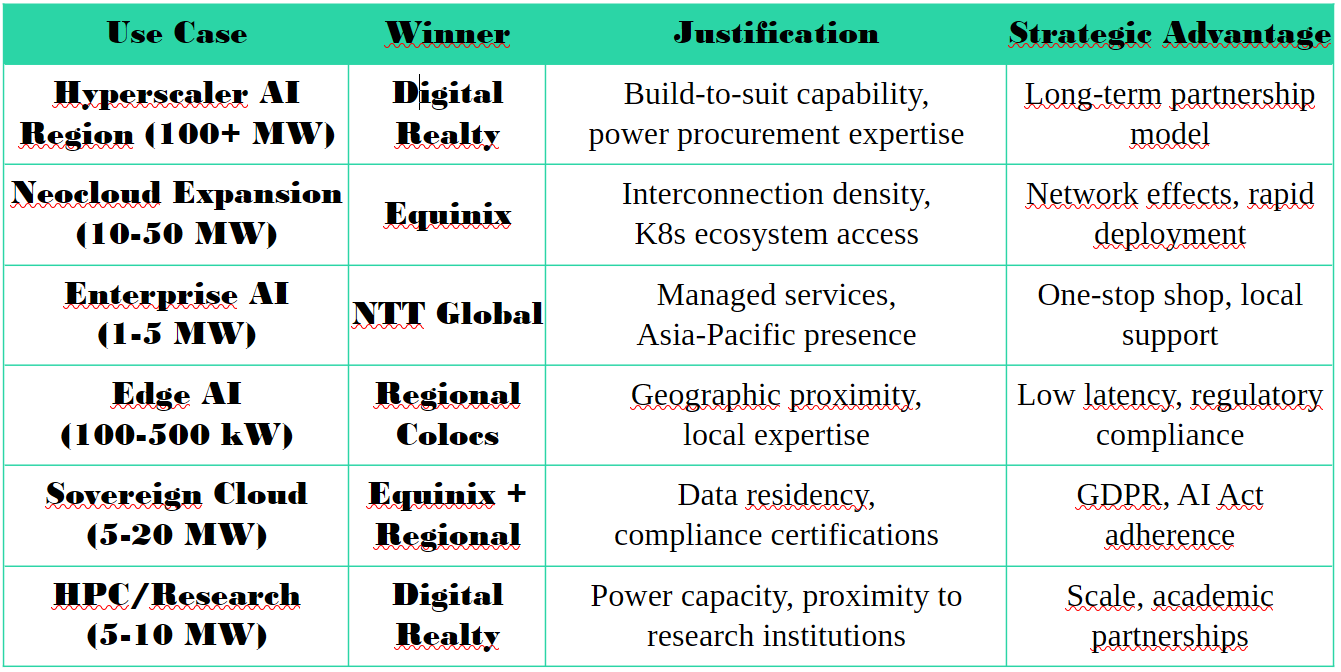
Datacenter Practitioner’s View:
Colocation providers are the picks and shovels of the AI gold rush. They don’t compete with hyperscalers or neoclouds—they enable them. The strategic insight: power procurement is the moat. Securing 100+ MW of power in Northern Virginia, Frankfurt, or Singapore takes 4+ years of permitting, utility negotiations, and substation construction. Once a colocation provider locks in that power, they have a decade-long advantage over new entrants. The risk: technology obsolescence. If hyperscalers successfully deploy small modular reactors (SMRs) or off-grid solutions by 2030, they could bypass colocation providers entirely. However, this is a 2030+ scenario; for now, colocation remains essential.
Part 4: Market Dynamics & Evolution (2024-2030)
Short-Term Trends (2024-2027)
1. GPU Supply Constraints Drive Pricing Power:
-
-
-
-
NVIDIA H100/B200 Allocation: Hyperscalers receive priority, neoclouds face 6-12 month lead times
-
Pricing Impact: Neoclouds charge 20-30% premium for immediate availability
-
Winner: Providers with existing GPU inventory (CoreWeave, Lambda Labs)
-
-
-
2. Power Procurement Becomes Critical Path:
-
-
-
-
Grid Interconnection Delays: 4+ years in primary markets (Northern Virginia, Amsterdam)
-
Strategic Shift: Hyperscalers/neoclouds expanding to secondary markets (Phoenix, Columbus, Milan)
-
Winner: Colocation providers with existing power capacity
-
-
-
3. Liquid Cooling Mandate:
-
-
-
-
Threshold: Air cooling inadequate above 20 kW/rack; AI workloads require 40-100 kW/rack
-
CapEx Impact: $2-3M/MW for direct-to-chip; $4-5M/MW for immersion cooling
-
Winner: Providers with liquid cooling expertise (Equinix, Digital Realty, Crusoe)
-
-
-
4. Inference Workload Growth:
-
-
-
-
Shift: Inference grows from 40% (2024) to 58% (2027) of AI infrastructure spend
-
Implication: Demand for cost-optimized inference chips (AWS Inferentia, Groq, Etched)
-
Winner: Hyperscalers with custom silicon (AWS, GCP)
-
-
-
Medium-Term Trends (2027-2030)
1. Market Consolidation:
-
-
-
-
Neocloud M&A: Smaller GPUaaS providers acquired by hyperscalers or private equity
-
Colocation Consolidation: Regional players merge to achieve scale
-
Prediction: 50% of current neoclouds will be acquired or fail by 2030
-
-
-
2. Sovereign AI Expansion:
-
-
-
-
Regulatory Driver: EU AI Act, data sovereignty laws in Middle East/Asia
-
Infrastructure Need: Regional AI datacenters with local data residency
-
Winner: European neoclouds (Scaleway, Nebius), OCI Dedicated Region
-
-
-
3. Custom Silicon Disruption:
-
-
-
-
Technology: AWS Trainium2, GCP TPU v6, custom inference ASICs
-
Price-Performance: 5-10x better than NVIDIA GPUs for specific workloads
-
Impact: Hyperscalers gain 20-30% margin advantage on inference workloads
-
Winner: AWS, GCP (custom silicon leaders)
-
-
-
4. Edge AI Proliferation:
-
-
-
-
Trend: 30% of inference workloads move to edge by 2030
-
Infrastructure: Micro-datacenters (5-10 kW racks) at factories, hospitals, cell towers
-
Winner: Regional colocation providers, NTT Global (managed edge services)
-
-
-
5. Sustainable AI Imperative:
-
-
-
-
Regulatory Pressure: EU mandates PUE ≤1.2 by 2027, carbon neutrality by 2030
-
Technology: Small Modular Reactors (SMRs), waste heat recovery, renewable PPAs
-
Winner: Crusoe (carbon-negative), GCP (renewable leader), OCI (nuclear PPA exploration)
-
-
-
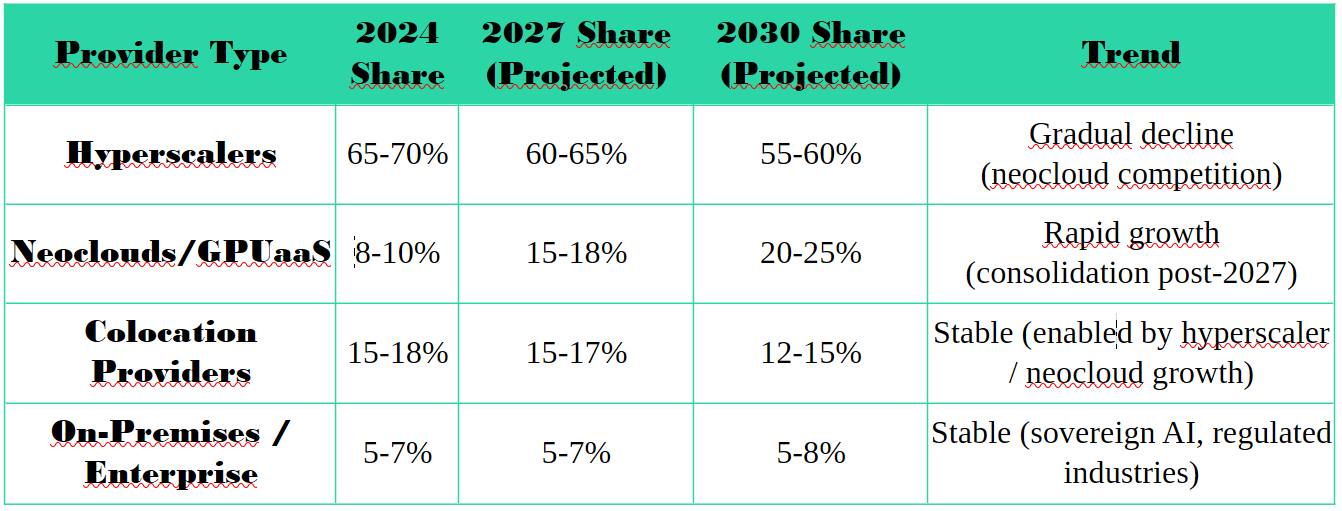
Market Share Projections (2024 vs. 2030)
Table 10: AI Infrastructure Market Share Evolution
Datacenter Practitioner’s View:
The market is not zero-sum. Total AI infrastructure spend will grow from ~$50B (2024) to $500B+ (2030), creating room for all players. However, the composition will shift dramatically. Hyperscalers will maintain dominance but lose share to neoclouds in pure GPU workloads. Colocation providers will remain essential enablers but face margin pressure from liquid cooling CapEx. The critical insight: specialization wins. Generic “cloud providers” will struggle; specialized players (CoreWeave for training, Crusoe for sustainability, Equinix for interconnection) will command premium valuations.
Summary Tables: Competitive Landscape Overview
Table 11: Comprehensive Provider Comparison
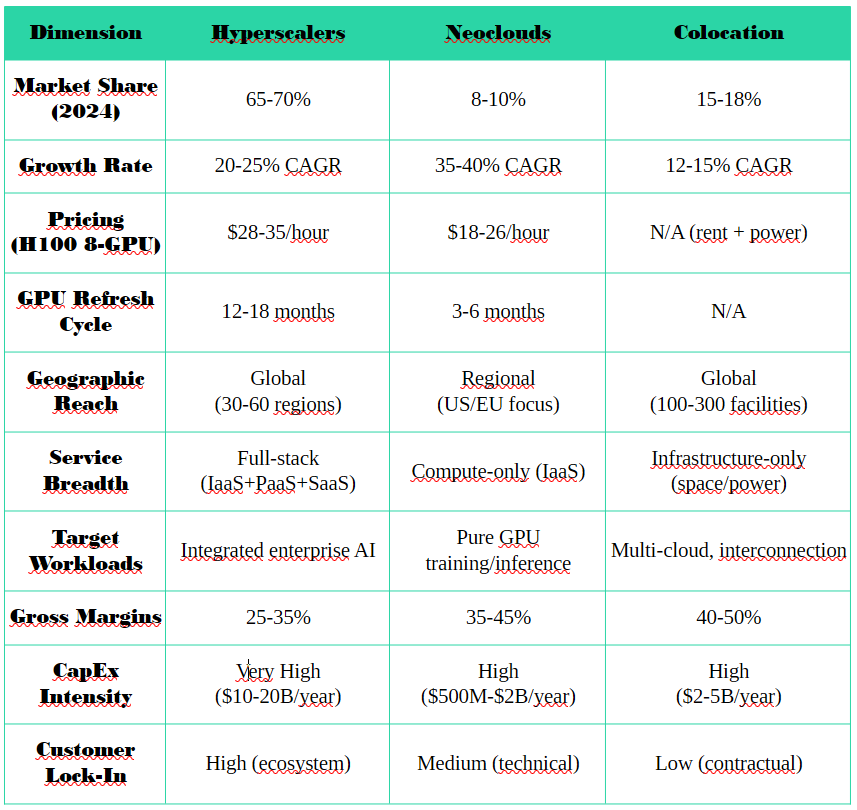
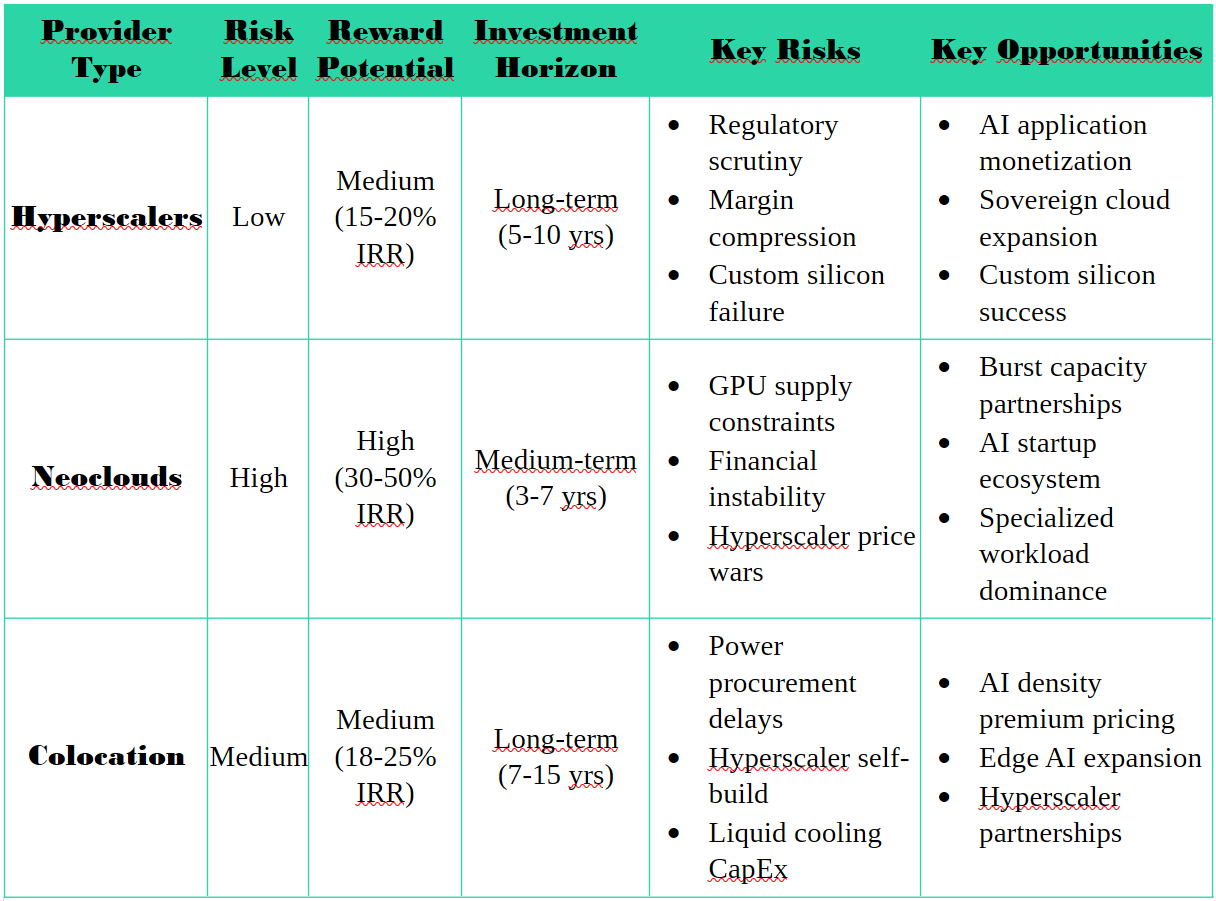
Table 12: Investment Perspective – Risk/Reward Analysis
Final Takeaways
The AI infrastructure competitive landscape is stratifying into distinct layers, each with unique value propositions:
-
- Layer 1 – Hyperscalers (AWS, Azure, GCP, OCI): Dominate through ecosystem integration and global scale. They win when AI is part of a broader digital transformation strategy. Their moat is not GPUs—it’s the 200+ integrated services, enterprise relationships, and compliance certifications.
- Layer 2 – Neoclouds (CoreWeave, Lambda, Crusoe): Win through specialization and price-performance. They’re the “picks and shovels” for AI-native companies that need raw GPU power without ecosystem lock-in. Their risk is financial sustainability; their opportunity is becoming the “AWS of GPUs.”
- Layer 3 – Colocation Providers (Equinix, Digital Realty, NTT): Serve as enablers for both hyperscalers and neoclouds. Their moat is power procurement expertise and real estate in prime locations. They’re the safest investment—recurring revenue, long-term contracts—but face CapEx pressure from liquid cooling requirements.
The Critical Insight: Multi-cloud is not a strategy—it’s a necessity. Enterprises will use hyperscalers for integrated applications, neoclouds for burst training, and colocation for data sovereignty. The winners will be those who orchestrate across these layers seamlessly, not those who try to own all layers.
Looking Ahead to Article 3: Now that we understand the competitive landscape, we’ll dive into the technical architectures powering these facilities—rack-level designs, GPU vs. non-GPU accelerators, memory hierarchies (HBM4, LPDDR5, SOCAMM2), ultra-low latency networking, and the power/cooling innovations enabling 100+ kW/rack densities.
References & Further Reading
-
-
Synergy Research. “Cloud Market Share Q1 2024.” https://www.srgc.com/cloud-market-share-q1-2024/
-
Reuters. “Oracle Expects Cloud Infrastructure Revenue to Be $166B by FY30.” October 16, 2025. https://www.reuters.com/technology/oracle-expects-cloud-infrastructure-revenue-be-166-bln-fy30-2025-10-16/
-
CoreWeave. “GPU Cloud Pricing.” https://www.coreweave.com/pricing
-
Uptime Institute. “Neoclouds: A Cost-Effective AI Infrastructure Alternative.” February 26, 2025. https://journal.uptimeinstitute.com/neoclouds-a-cost-effective-ai-infrastructure-alternative/
-
Data Center Dynamics. “Trend Report: Data Centres in the Age of AI.” March 28, 2025. https://datacentrereview.com/2025/03/trend-report-data-centres-in-the-age-of-ai/
-
PwC. “Data Centers at the Crossroads of Technology and Resilience.” February 25, 2025. https://www.pwc.com/us/en/industries/tmt/library/hyperscale-data-center.html
-
Gartner. “AI Infrastructure Outlook 2024.” https://www.gartner.com/en/information-technology/insights/artificial-intelligence
-
JLL. “2025 Data Center Outlook.” https://www.jll.com/en/trends/insights/data-center-outlook-2025
-
McKinsey. “Data Center Growth in the Age of AI.” https://www.mckinsey.com/industries/technology-media-and-telecommunications/our-insights/data-center-growth
-
Equinix. “Global Interconnection Index 2024.” https://www.equinix.com/resources/reports/global-interconnection-index
-
Digital Realty. “PlatformDIGITAL® Strategy.” https://www.digitalrealty.com/platform-digital
-
Crusoe Energy. “Carbon-Negative AI Infrastructure.” https://www.crusoeenergy.com/sustainability
-
Scaleway. “Sovereign AI Cloud.” https://www.scaleway.com/en/ai-cloud/
-
Lambda Labs. “GPU Cloud vs. On-Premises.” https://lambdalabs.com/gpu-cloud
-
Oracle. “OCI Generative AI Service.” https://www.oracle.com/artificial-intelligence/generative-ai/
-
About the Author:
As a Data & AI Infrastructure Expert, I’ve led 15+ “Design-Build-Operate” projects for AI datacenters across Life Sciences, Automotive, Energy, and Banking sectors. I’ve evaluated principal Neoclouds/GPUaaS providers (CoreWeave, Lambda Labs, Scaleway, Nebius, Crusoe) and colocation providers (Equinix, Digital Realty, NTT), benchmarked various accelerators (NVIDIA H200/B200, AMD MI300X, Intel Gaudi, Cerebras, Groq), and partnered with hyperscalers (Azure, Google Cloud, AWS, OCI) to architect and deliver high-density AI infrastructure. Earlier at Qualcomm, I created and developed a full-service Profit Center (150 FTEs) for end-to-end semiconductor design-validation-testing of AI/HPC accelerators and ultra-fast networking infrastructure.
Next Article Preview:
Ready to understand the technical architectures powering AI datacenters? In Article 3, we’ll examine rack-level designs, GPU vs. non-GPU accelerators (NVIDIA, AMD, Intel, Cerebras, Groq), memory hierarchies (HBM4, LPDDR5, SOCAMM2), ultra-low latency networking (InfiniBand, Spectrum-X, Cisco Silicon One), and the power/cooling innovations enabling 100+ kW/rack densities. [Subscribe to get notified when Article 3 publishes.]